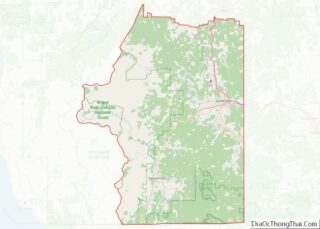
Grants Pass is the county seat of Josephine County, Oregon, United States. The city is located on Interstate 5, northwest of Medford, along the Rogue River. The population is 39,674 according to 2021 census.
| Name: | Grants Pass city |
|---|---|
| LSAD Code: | 25 |
| LSAD Description: | city (suffix) |
| State: | Oregon |
| County: | Josephine County |
| Incorporated: | 1887 |
| Elevation: | 960 ft (290 m) |
| Total Area: | 11.68 sq mi (30.25 km²) |
| Land Area: | 11.52 sq mi (29.83 km²) |
| Water Area: | 0.16 sq mi (0.42 km²) |
| Total Population: | 39,189 |
| Population Density: | 3,402.12/sq mi (1,313.58/km²) |
| ZIP code: | 97526, 97527, 97528, 97543 |
| FIPS code: | 4130550 |
| GNISfeature ID: | 1142947 |
| Website: | www.grantspassoregon.gov |
Online Interactive Map
Click on ![]() to view map in "full screen" mode.
to view map in "full screen" mode.
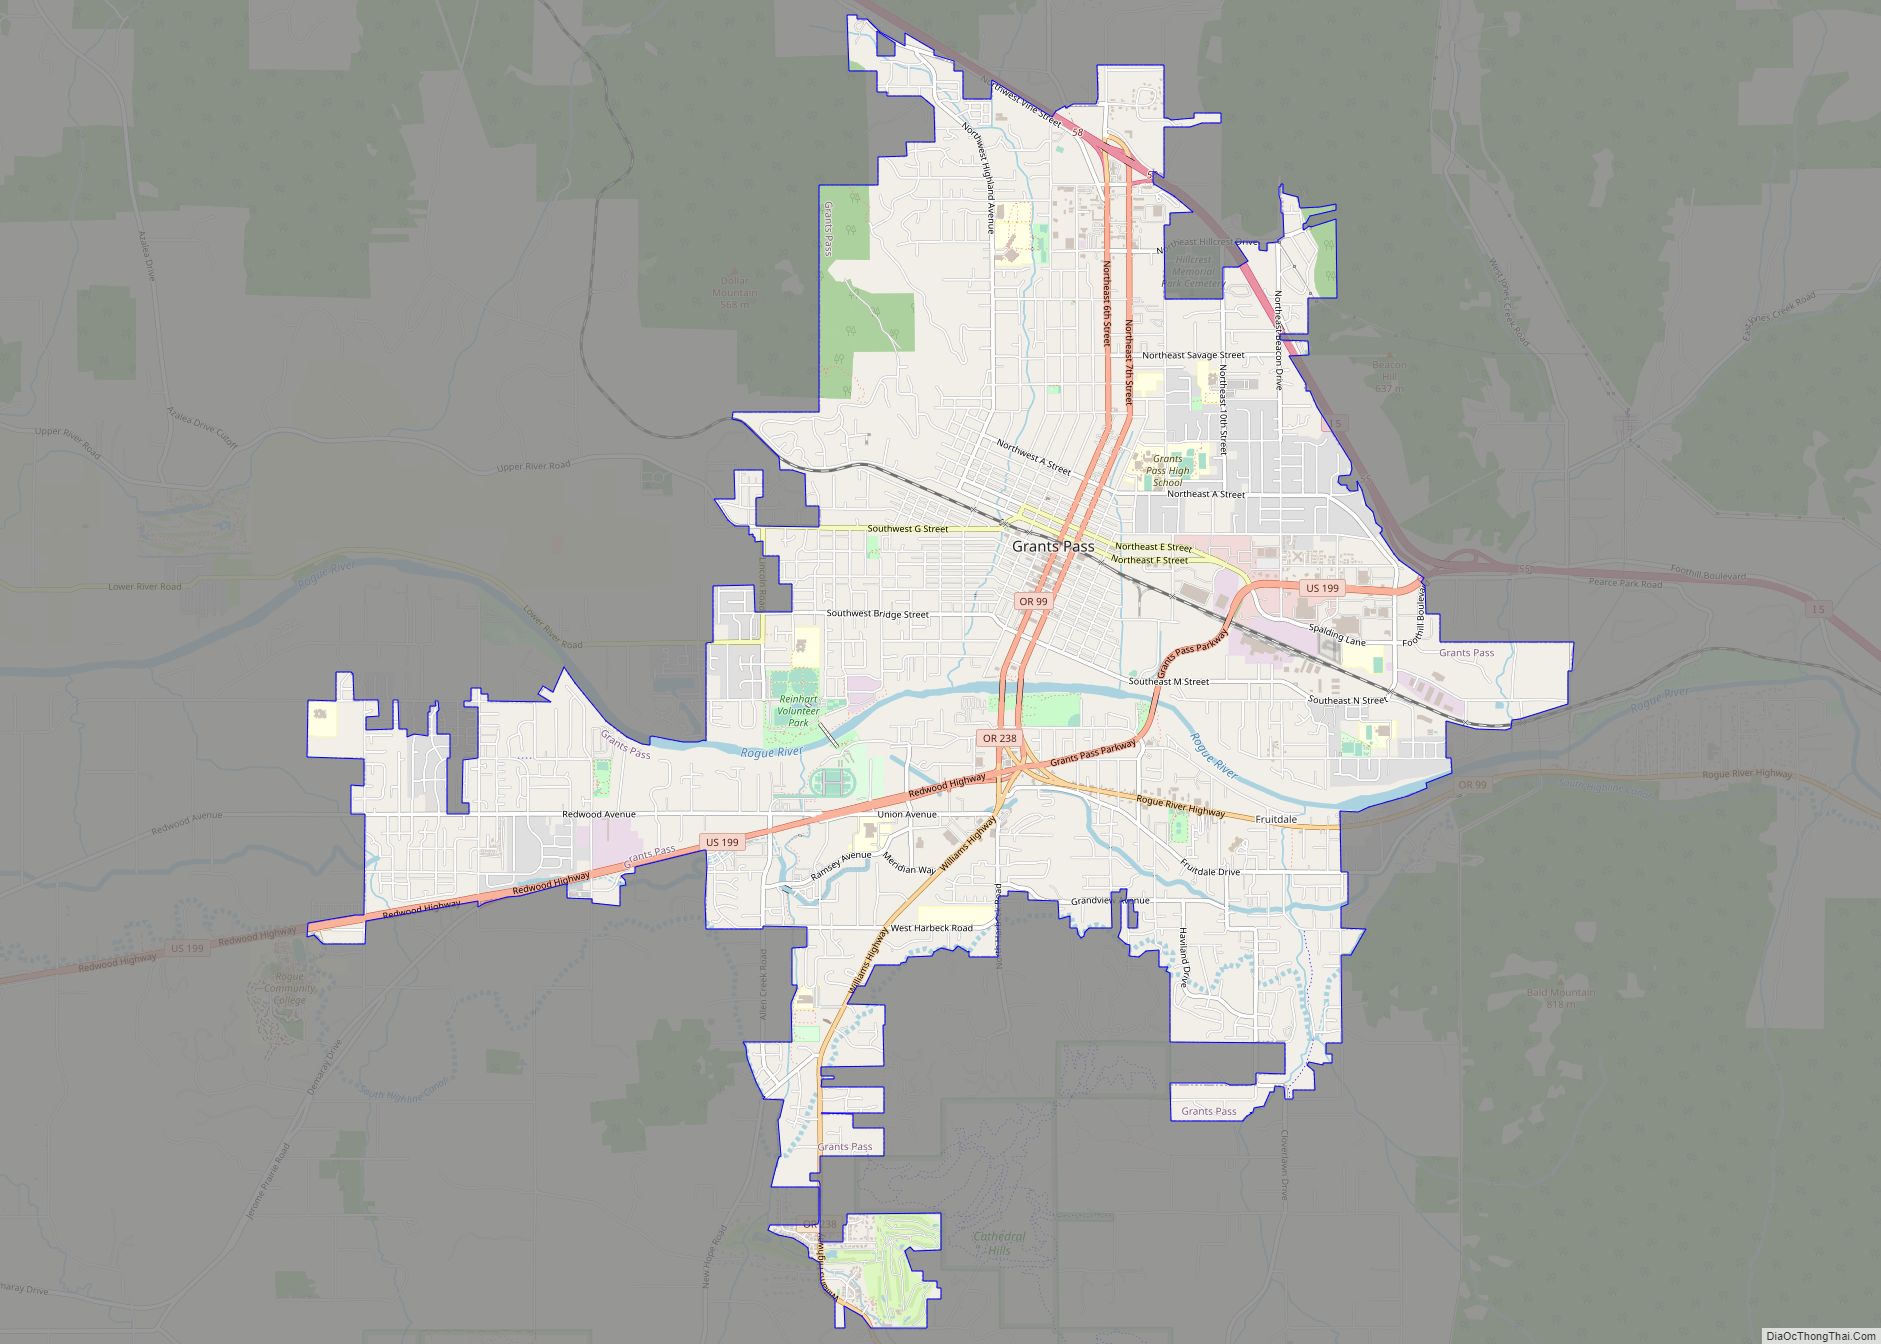
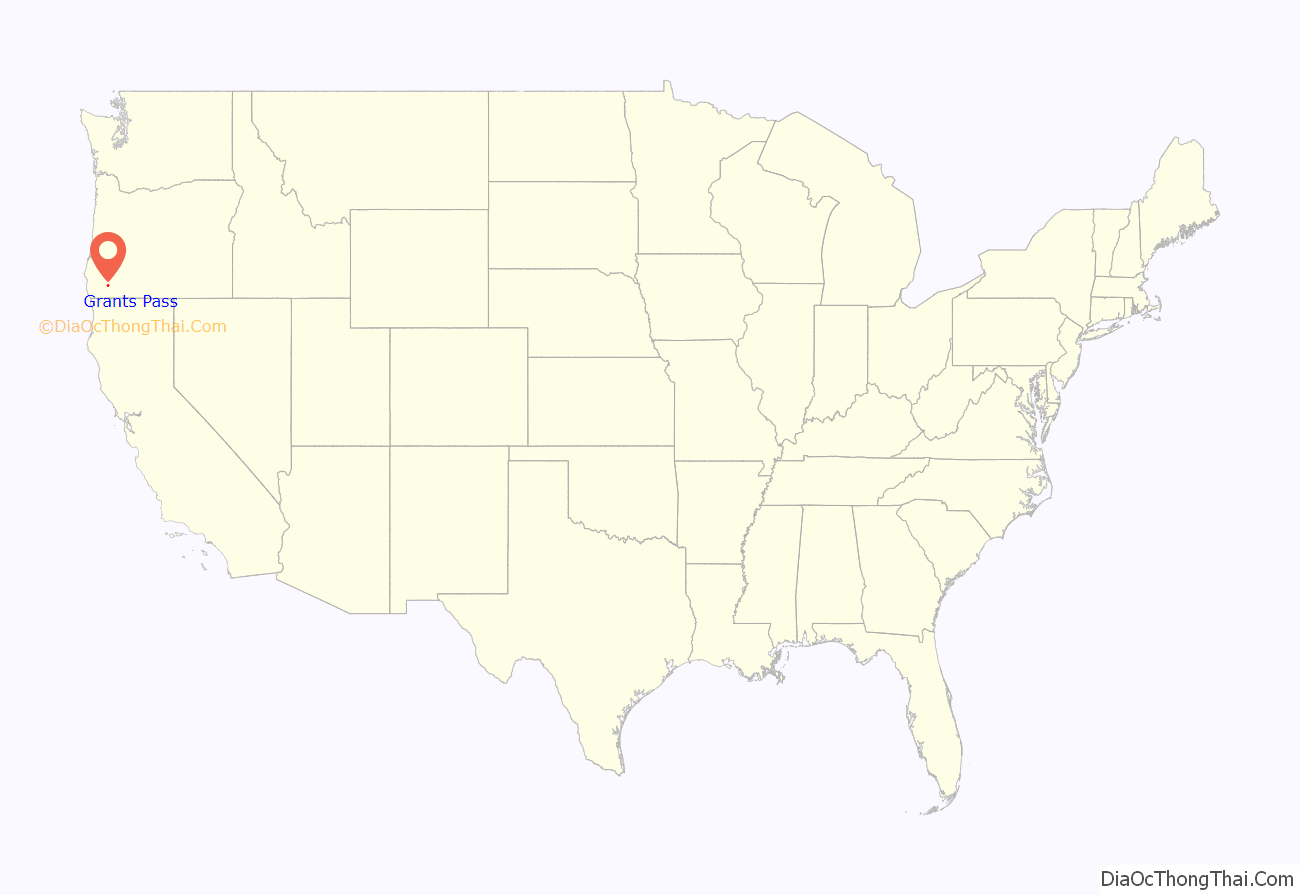
Grants Pass location map. Where is Grants Pass city?

History
Early Hudson’s Bay Company hunters and trappers, following the Siskiyou Trail, passed through the site beginning in the 1820s. In the late 1840s, settlers (mostly American) following the Applegate Trail began traveling through the area on their way to the Willamette Valley. The city states that the name was selected to honor General Ulysses S. Grant’s success at Vicksburg. The Grants Pass post office was established on March 22, 1865. The city of Grants Pass was incorporated in 1887.
The Oregon–Utah Sugar Company, financed by Charles W. Nibley, was created, leading to a sugar beet factory being built in Grants Pass in 1916. Before the factory opened, Oregon-Utah Sugar was merged into the Utah-Idaho Sugar Company. Due to labor shortages and low acreage planted in sugar beets, the processing machinery was moved to Toppenish, Washington, in 1918 or 1919.
Grants Pass, along with Medford and Ashland was an unofficial “sundown town”, which actively warned Black and other non-white people to leave town before sunset or face violence and harassment. Although there was no documented law of the racist policy, it was enforced locally via residents and signage.
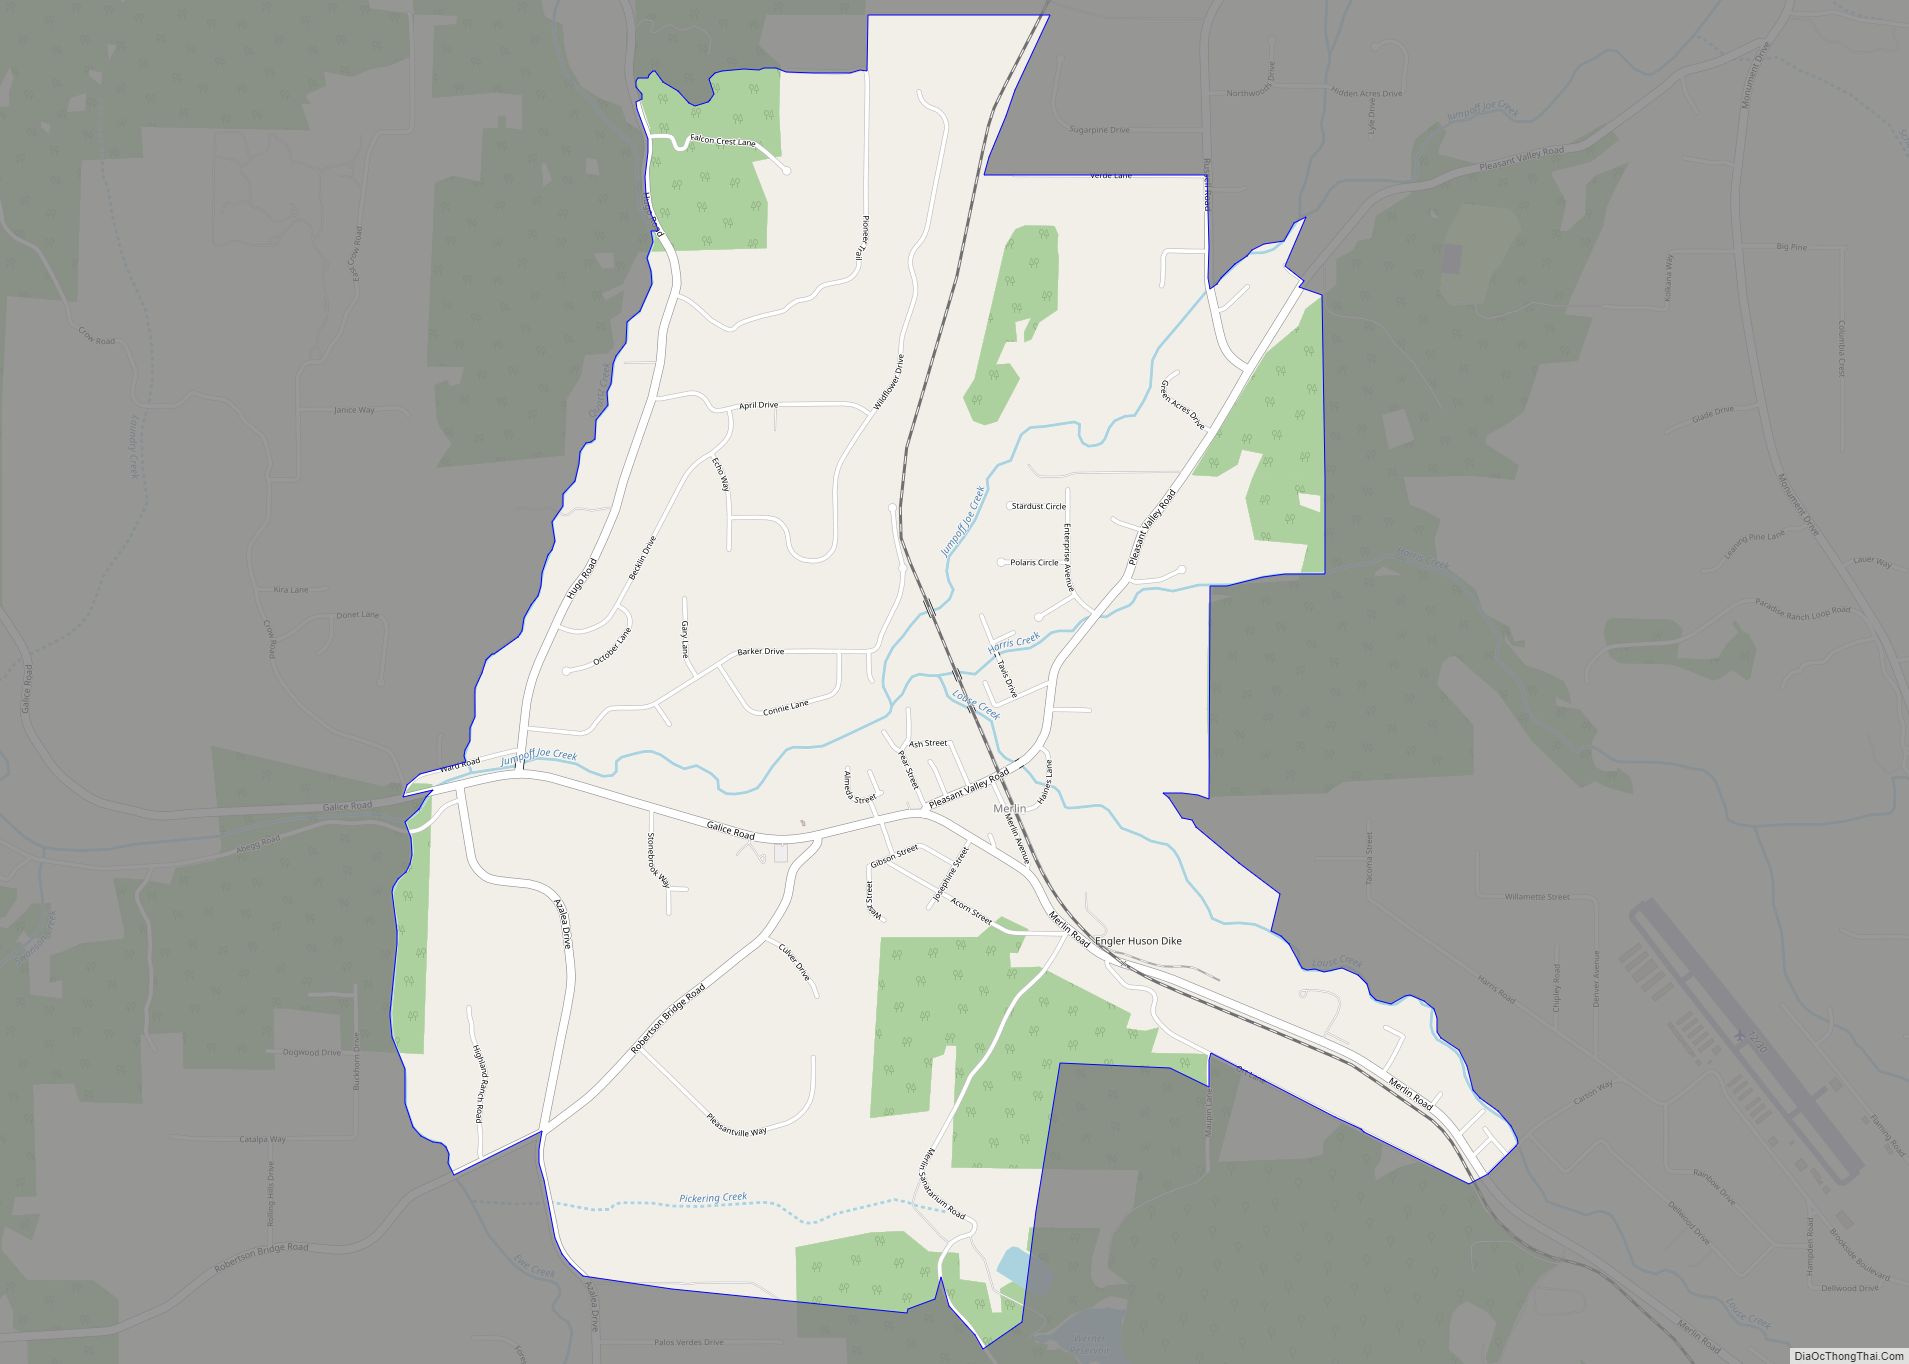
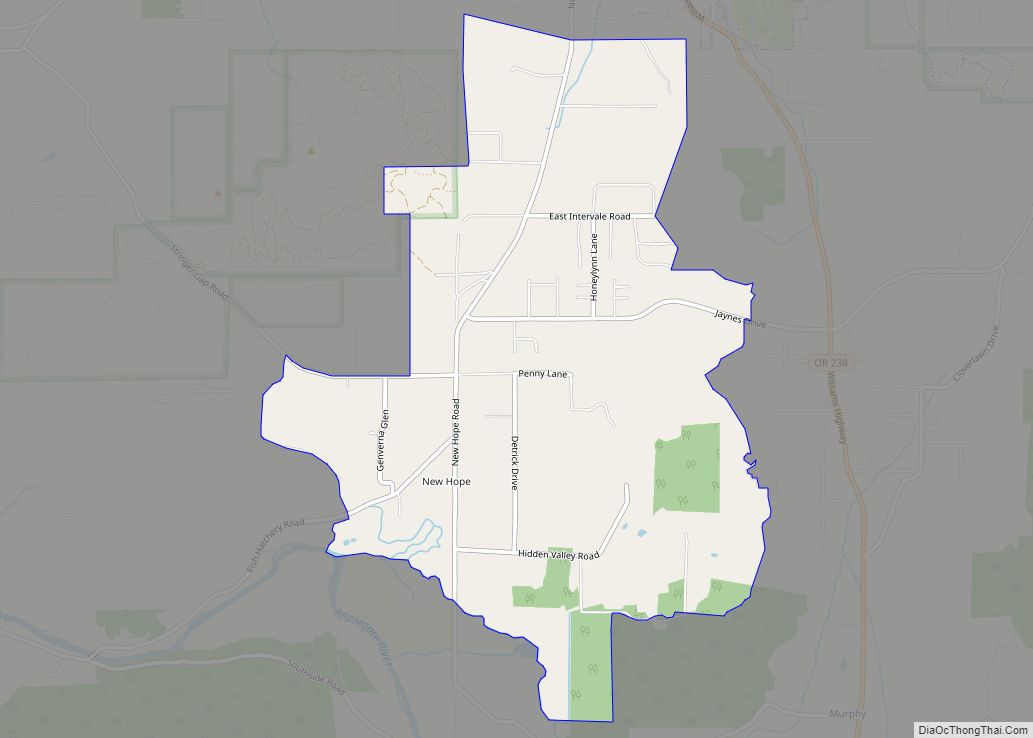
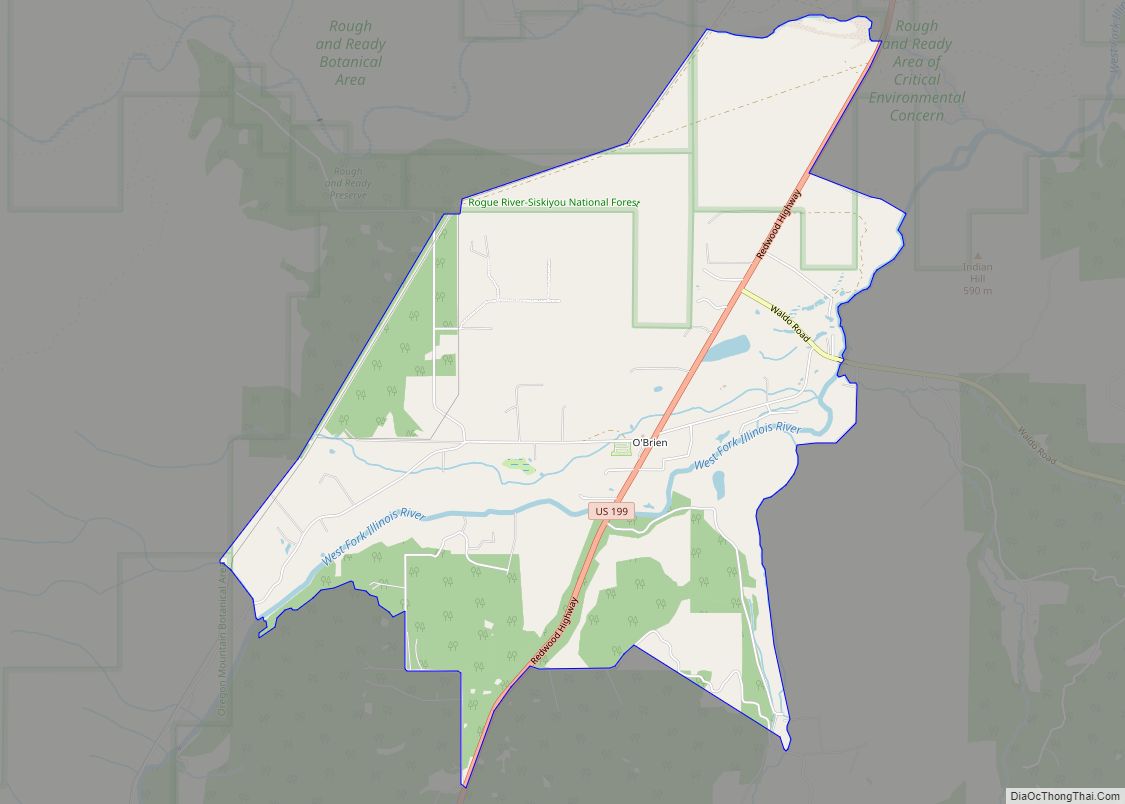
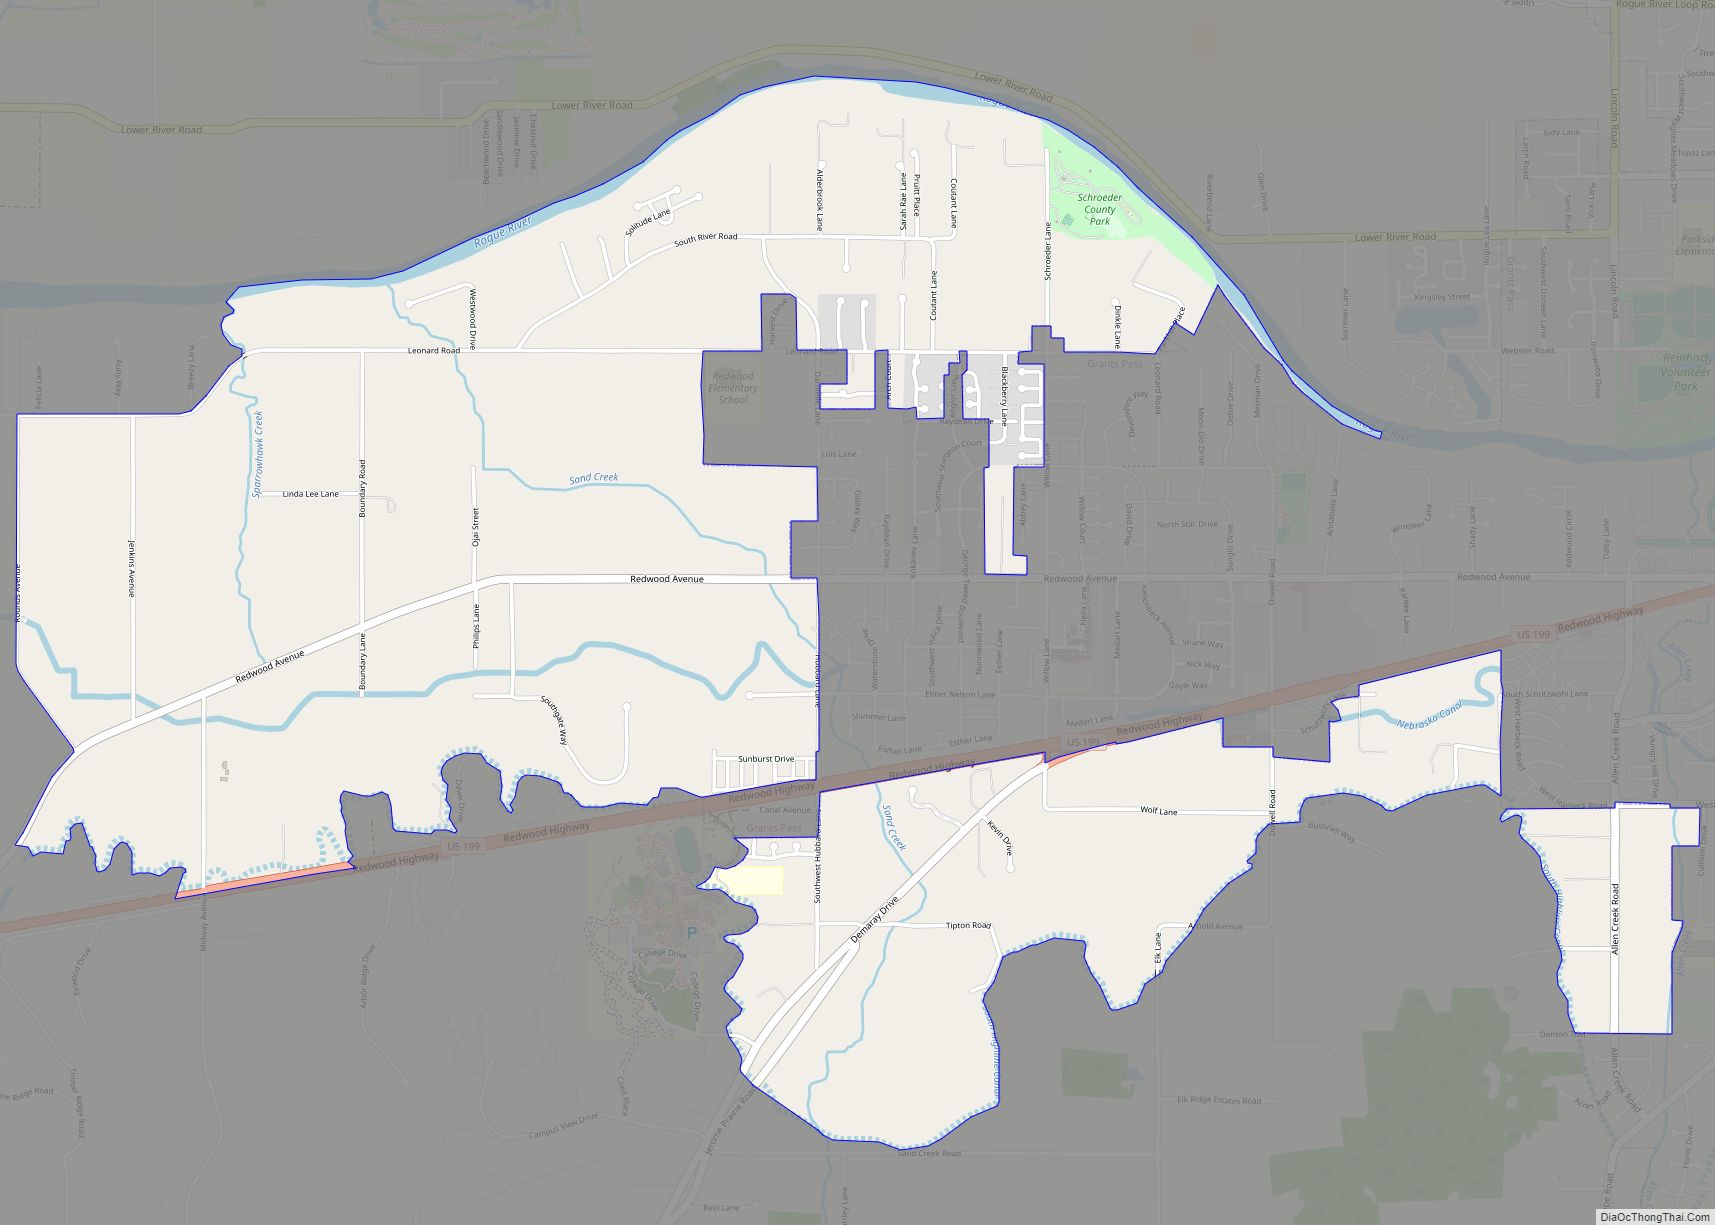
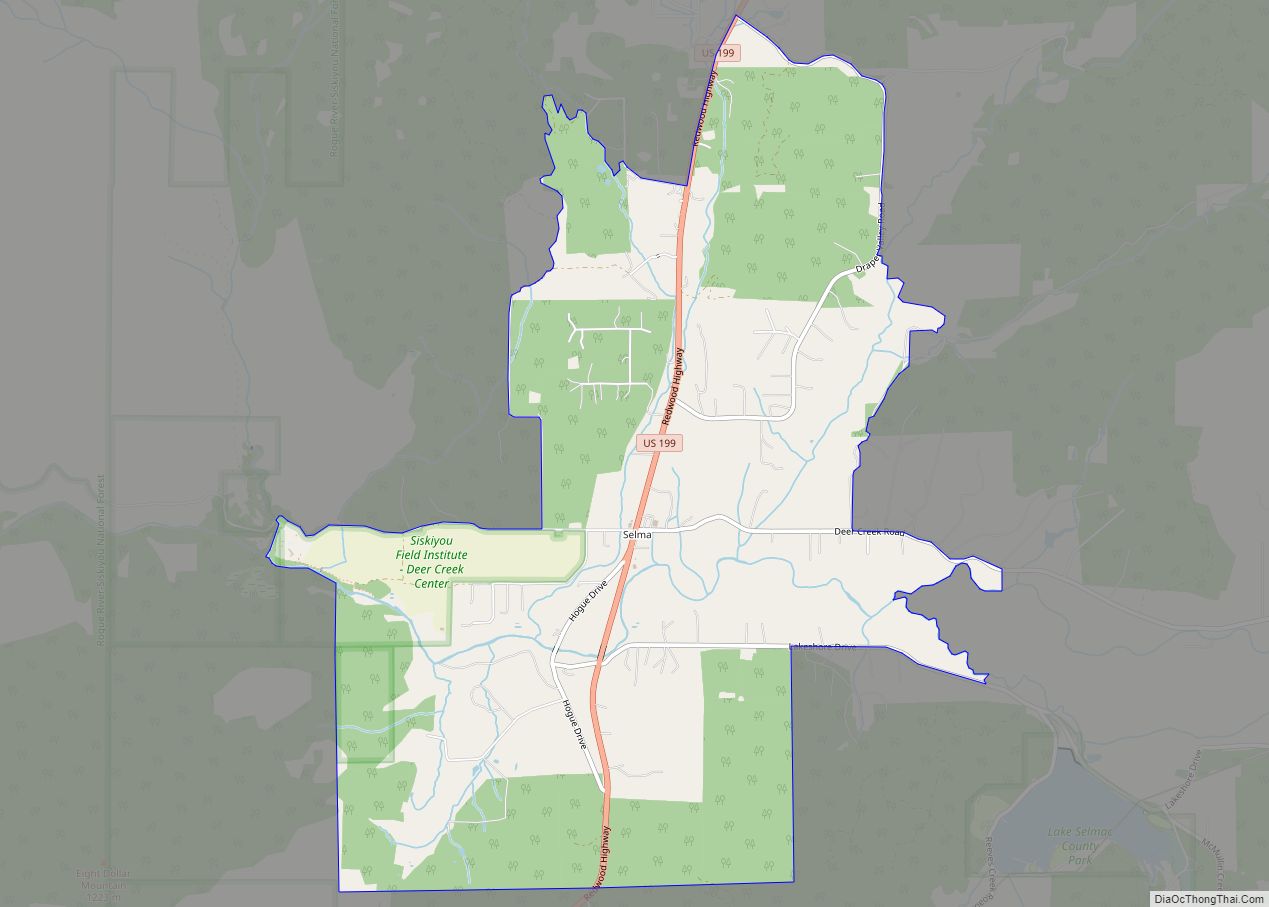
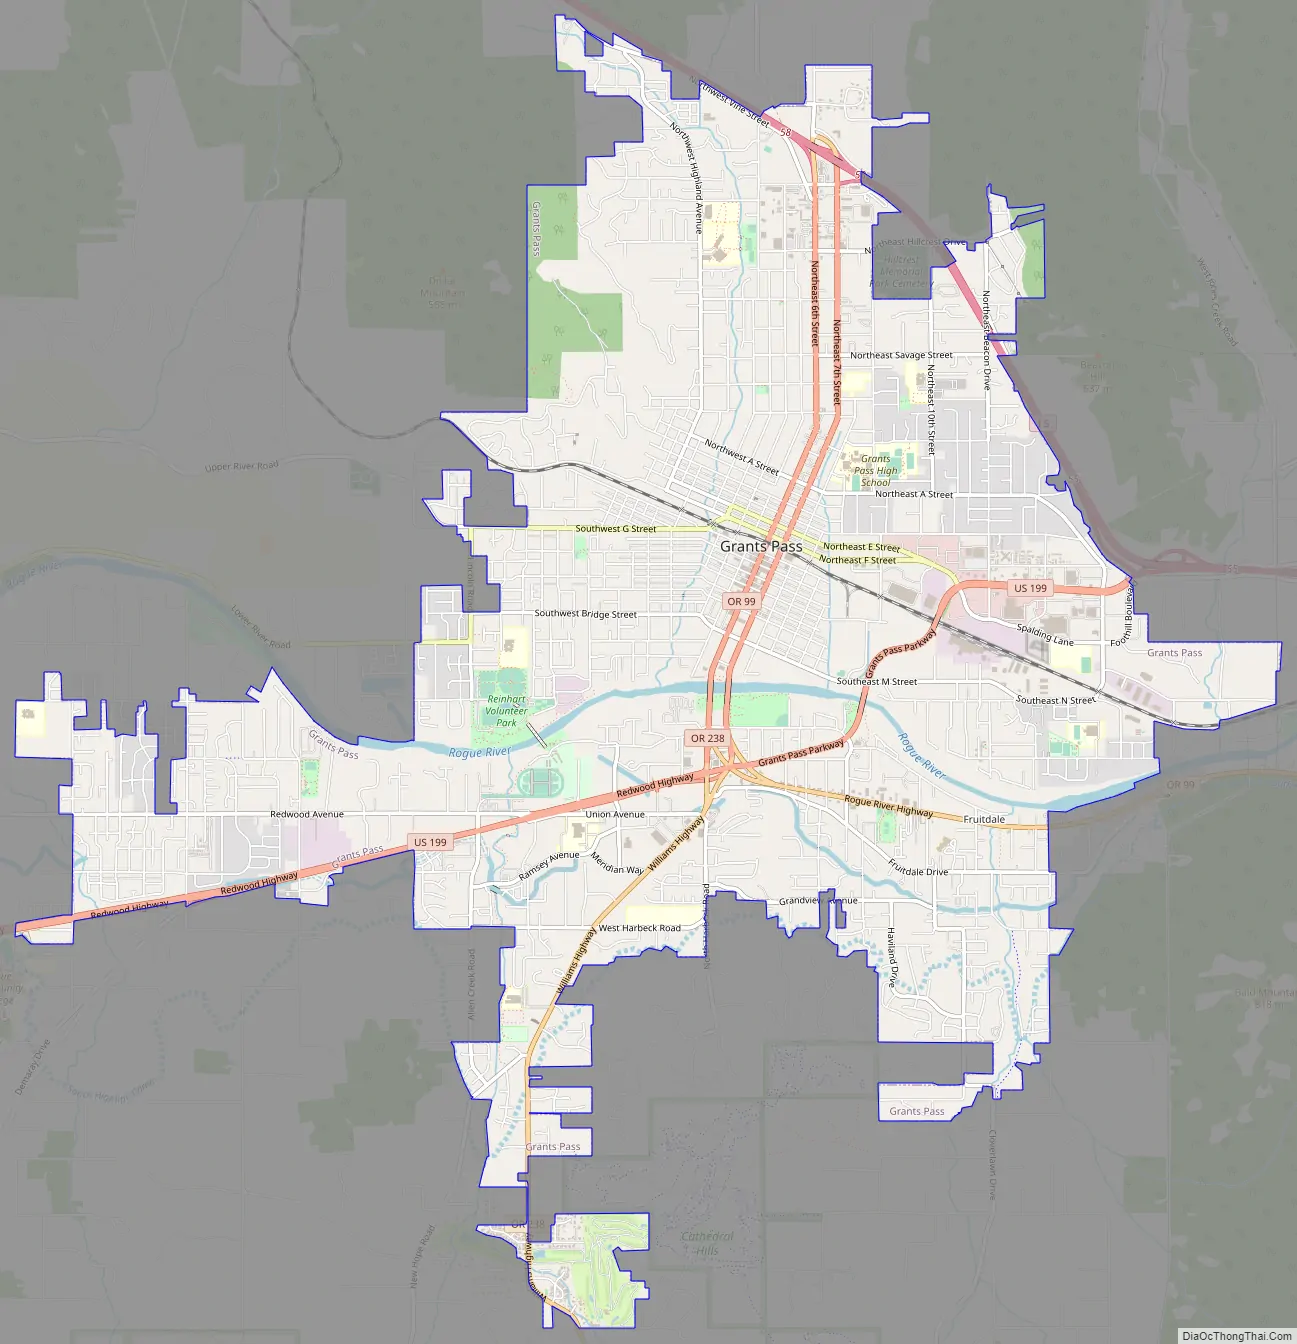
Grants Pass Road Map
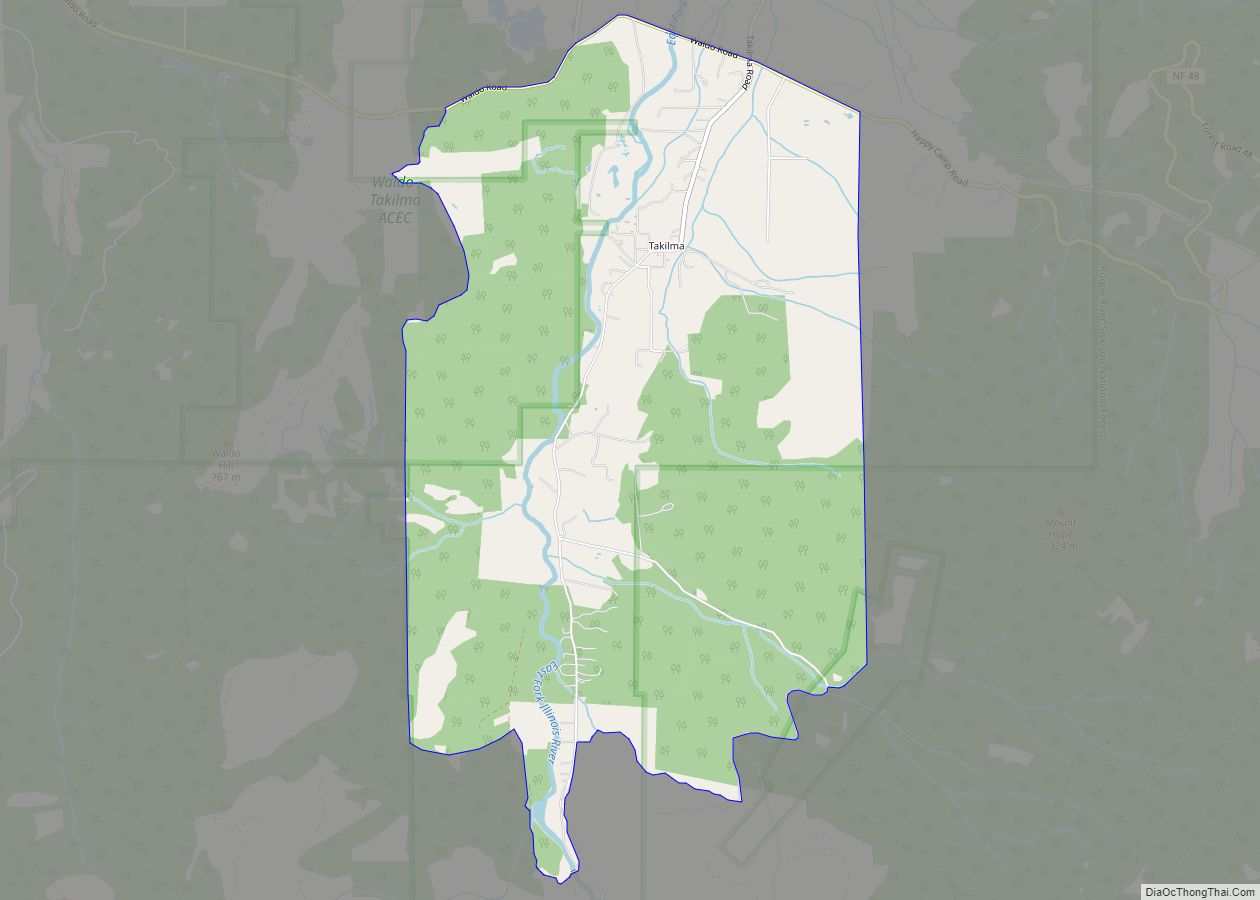
Grants Pass city Satellite Map
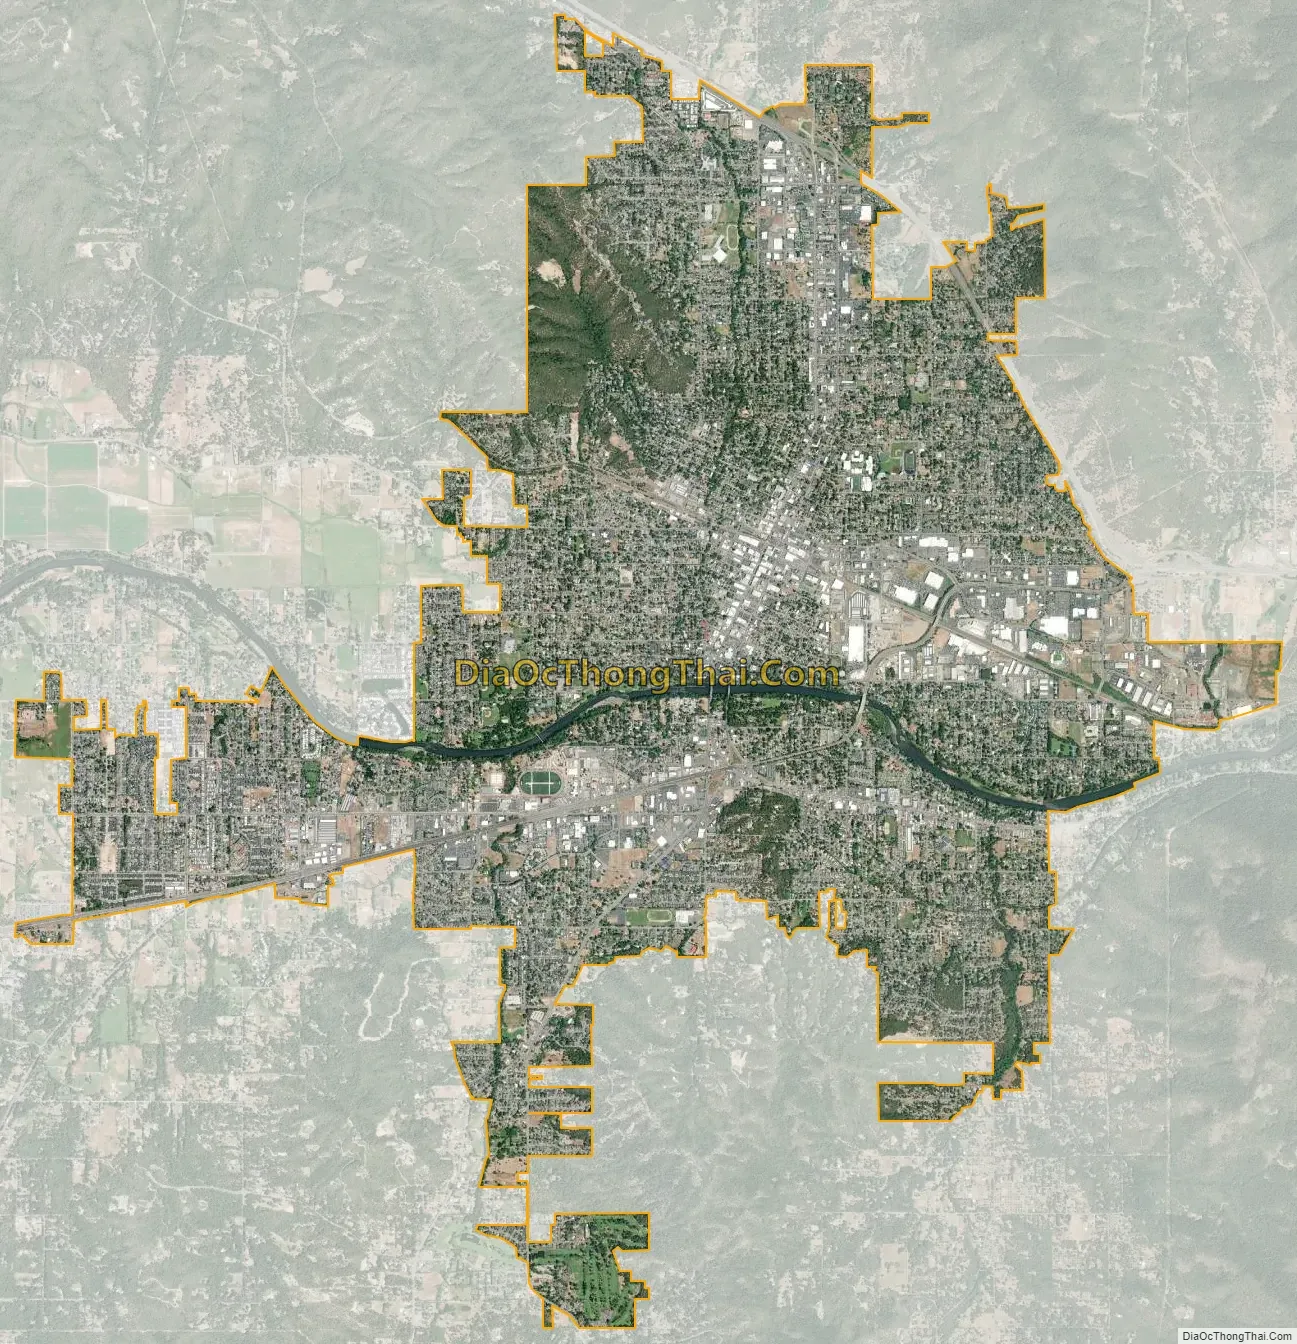
Geography
Grants Pass is located in the Rogue Valley; the Rogue River runs through the city. U.S. Route 199 passes through the city, and joins Interstate 5. The city has a total area of 11.03 square miles (28.6 km), of which 10.87 square miles (28.2 km) is land and 0.16 square miles (0.41 km) is water.
Climate
True to its motto, “It’s the climate!”, Grants Pass has a USDA plant hardiness zone 8b climate. According to the Köppen climate classification system, Grants Pass has a hot-summer Mediterranean climate (Csa).
Summer days are sunny, dry and hot, with dramatic cooling at night; the average August high temperature is 90.6 °F (32.6 °C) and the low is 54.9 °F (12.7 °C). Winters are cool and fairly rainy, with only occasional snow; the average January high temperature is 47.6 °F (8.7 °C) and the low is 35.3 °F (1.8 °C). Grants Pass receives roughly 31 inches (790 mm) precipitation per year, with three-quarters of it occurring between November 1 and March 31. The mild winters and dry summers support a native vegetation structure quite different from the rest of Oregon, dominated by madrone, deciduous and evergreen oak, manzanita, pine, bush chinquapin, and other species that are far less abundant further north.
The record high temperature of 114 °F (46 °C) was on July 23, 1928. The record low temperature of −3 °F (−19 °C) was on December 21, 1990. There are an average of 51.3 afternoons annually with highs of 90 °F (32 °C) or higher, eight afternoons reaching at least 100 °F (38 °C), and 77.5 mornings annually with lows of 32 °F (0 °C) or lower.
Measurable precipitation falls on an average of 110 days annually. The wettest rain year on record was from July 1955 to June 1956 with 50.69 inches (1,288 mm) of precipitation, and the driest from July 1923 to June 1924 with 13.43 inches (341 mm). The most precipitation in one month was 20.63 inches (524 mm) in December 1996, and the most precipitation in one day was 5.27 inches (134 mm) on October 29, 1950 – part of a two-day fall of 9.38 inches (238 mm) and ending a five-day fall of 11.26 inches (286 mm). There is an average of only 4.6 inches (0.12 m) of snow annually. The most snowfall in one month was 34.1 inches (0.87 m) in February 1917.
See also
Map of Oregon State and its subdivision: Map of other states:- Alabama
- Alaska
- Arizona
- Arkansas
- California
- Colorado
- Connecticut
- Delaware
- District of Columbia
- Florida
- Georgia
- Hawaii
- Idaho
- Illinois
- Indiana
- Iowa
- Kansas
- Kentucky
- Louisiana
- Maine
- Maryland
- Massachusetts
- Michigan
- Minnesota
- Mississippi
- Missouri
- Montana
- Nebraska
- Nevada
- New Hampshire
- New Jersey
- New Mexico
- New York
- North Carolina
- North Dakota
- Ohio
- Oklahoma
- Oregon
- Pennsylvania
- Rhode Island
- South Carolina
- South Dakota
- Tennessee
- Texas
- Utah
- Vermont
- Virginia
- Washington
- West Virginia
- Wisconsin
- Wyoming