Hayfork is a census-designated place (CDP) in Trinity County, California, United States. Its population is 2,324 as of the 2020 census, down from 2,368 from the 2010 census.
| Name: | Hayfork CDP |
|---|---|
| LSAD Code: | 57 |
| LSAD Description: | CDP (suffix) |
| State: | California |
| County: | Trinity County |
| Elevation: | 2,310 ft (704 m) |
| Total Area: | 72.120 sq mi (186.791 km²) |
| Land Area: | 72.098 sq mi (186.733 km²) |
| Water Area: | 0.022 sq mi (0.058 km²) 0.03% |
| Total Population: | 2,324 |
| Population Density: | 32/sq mi (12/km²) |
| ZIP code: | 96041 |
| Area code: | 530 |
| FIPS code: | 0632562 |
| GNISfeature ID: | 0277529 |
Online Interactive Map
Click on ![]() to view map in "full screen" mode.
to view map in "full screen" mode.
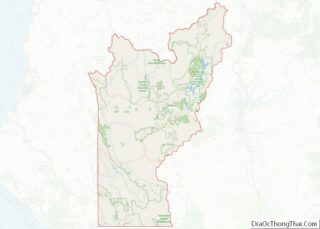
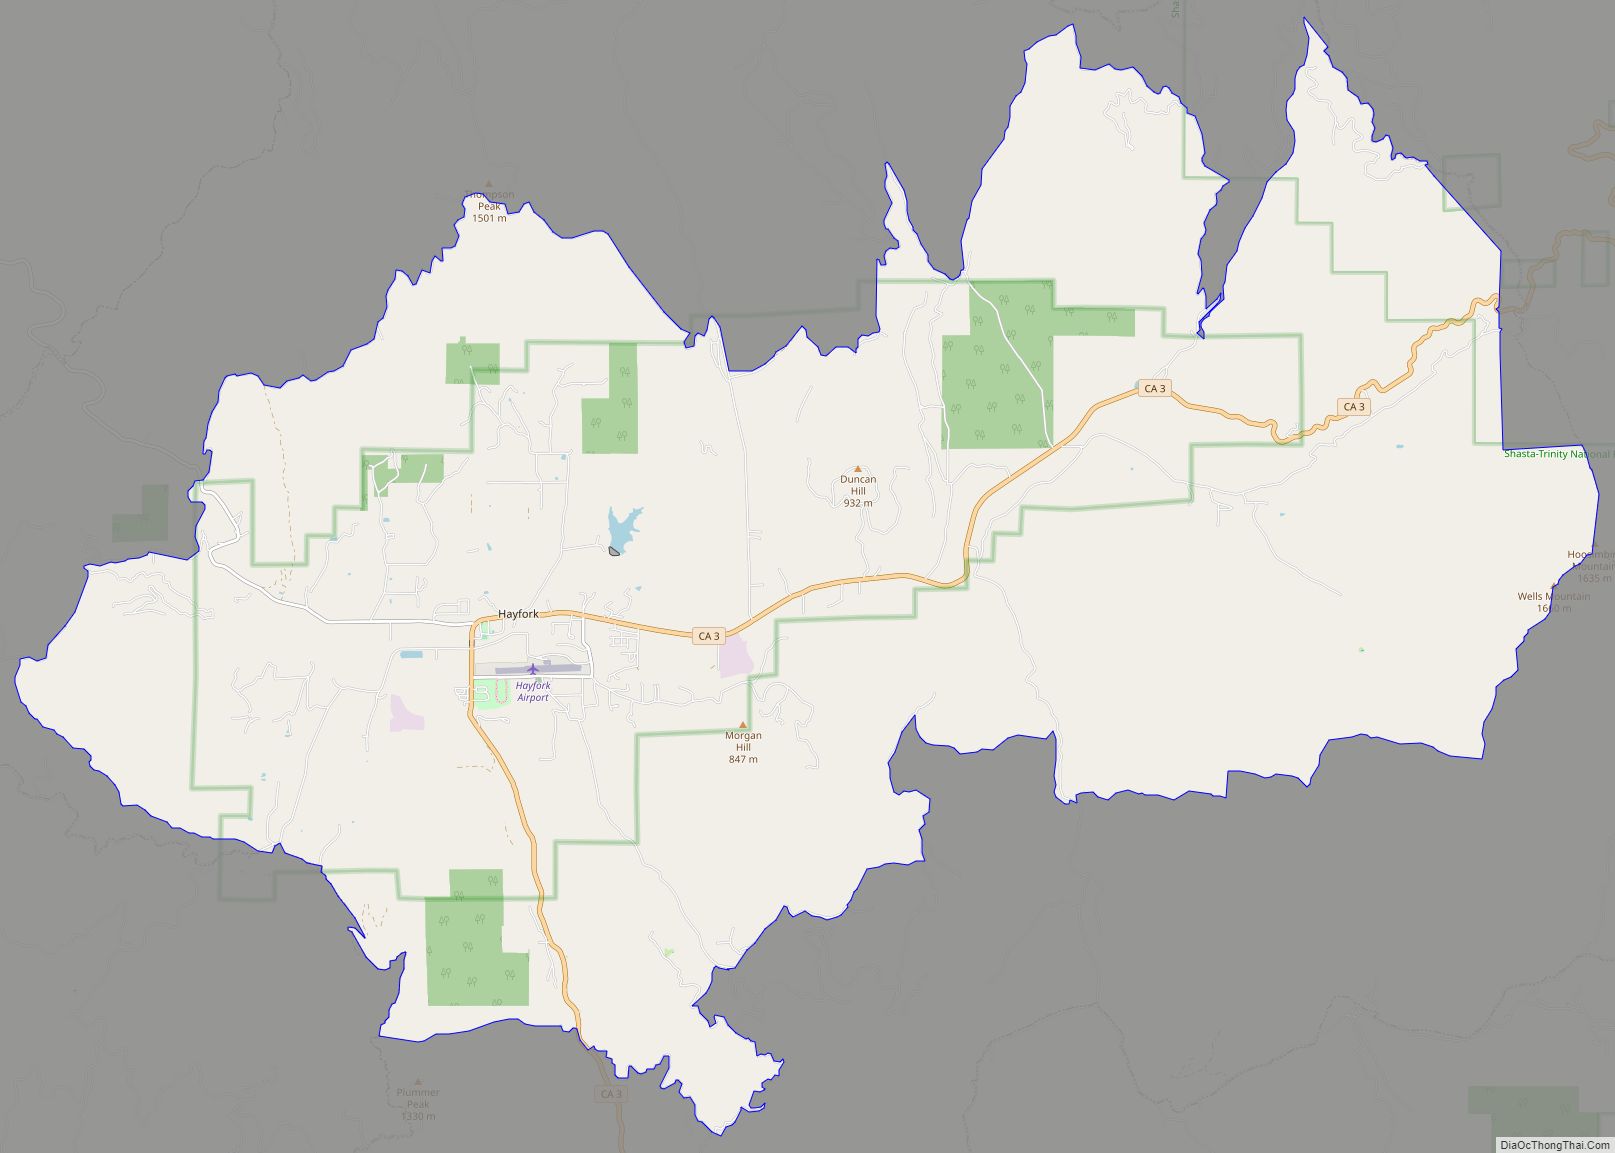
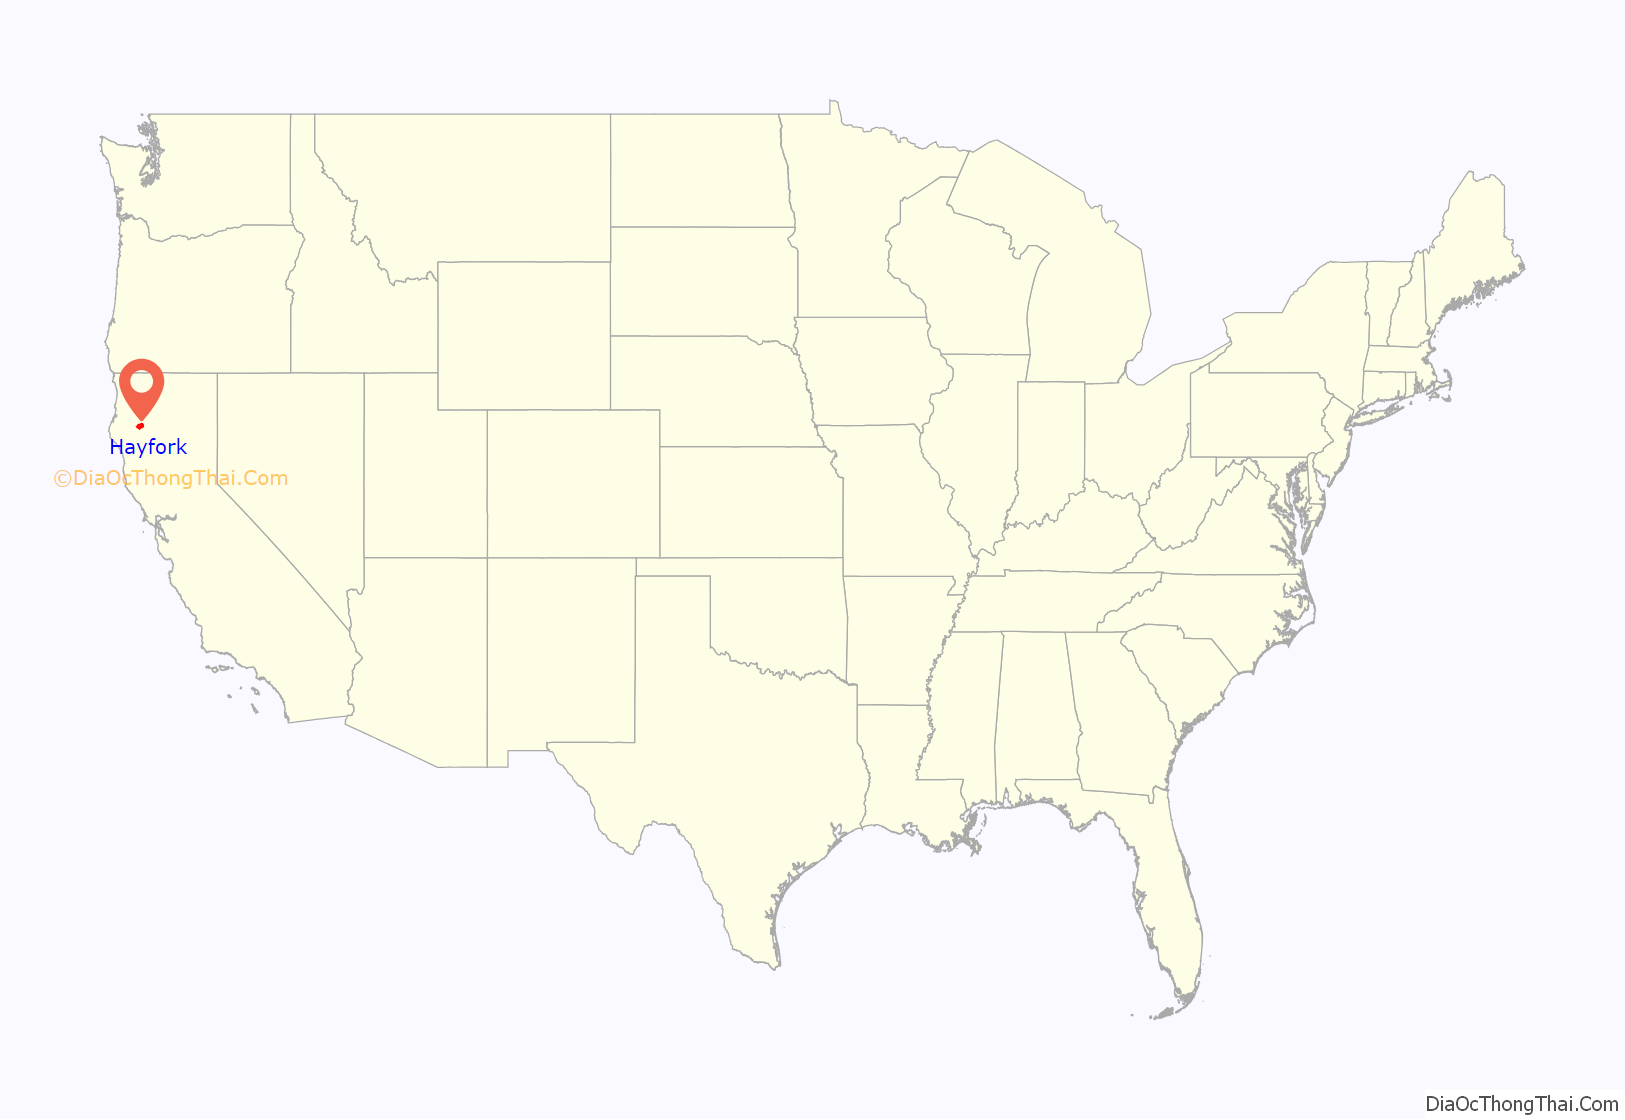
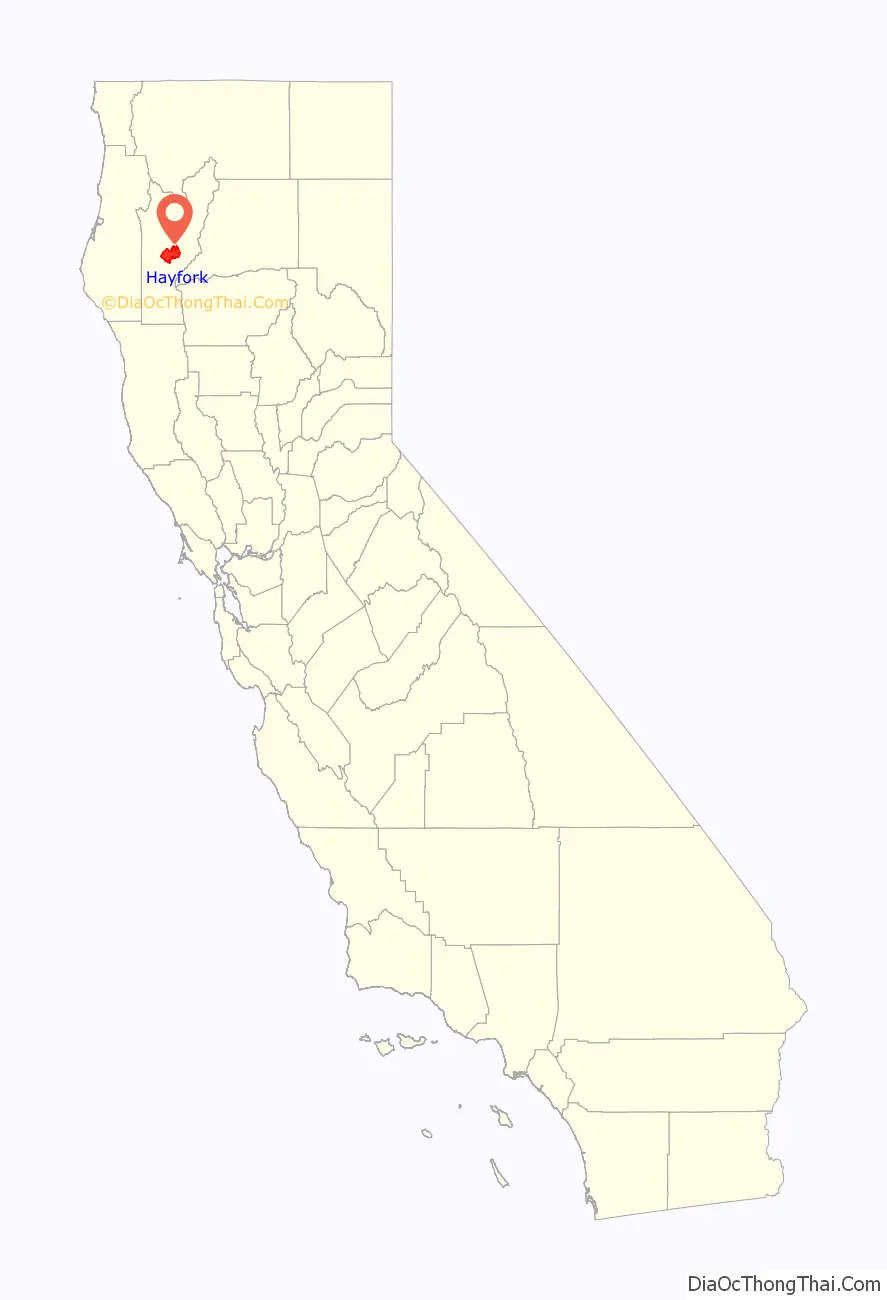
Hayfork location map. Where is Hayfork CDP?
History
In 1921 the first Trinity County Fair was held with the Governor at the time William Stephens [1]
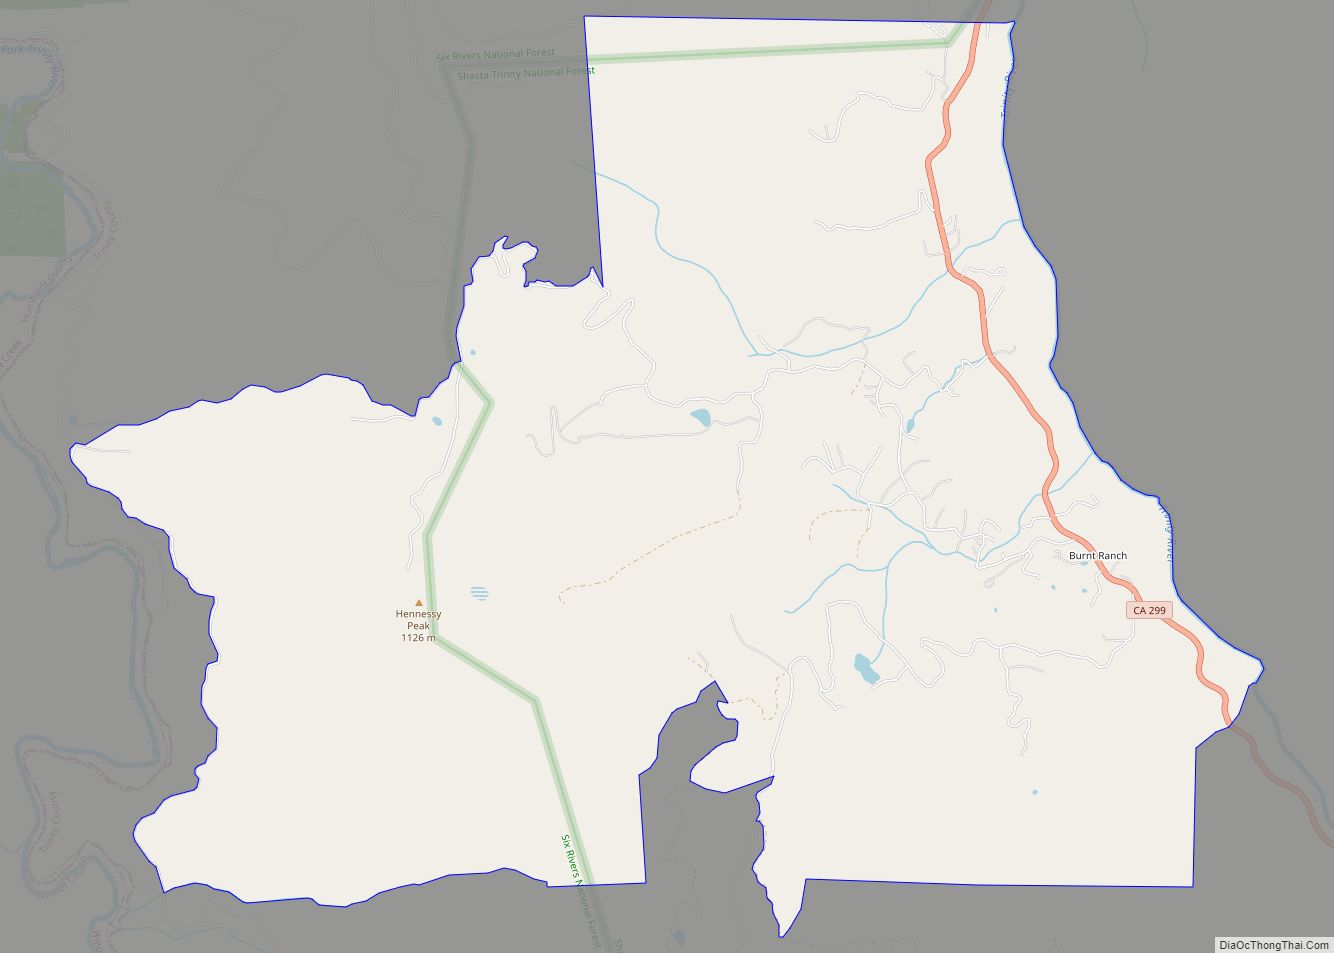
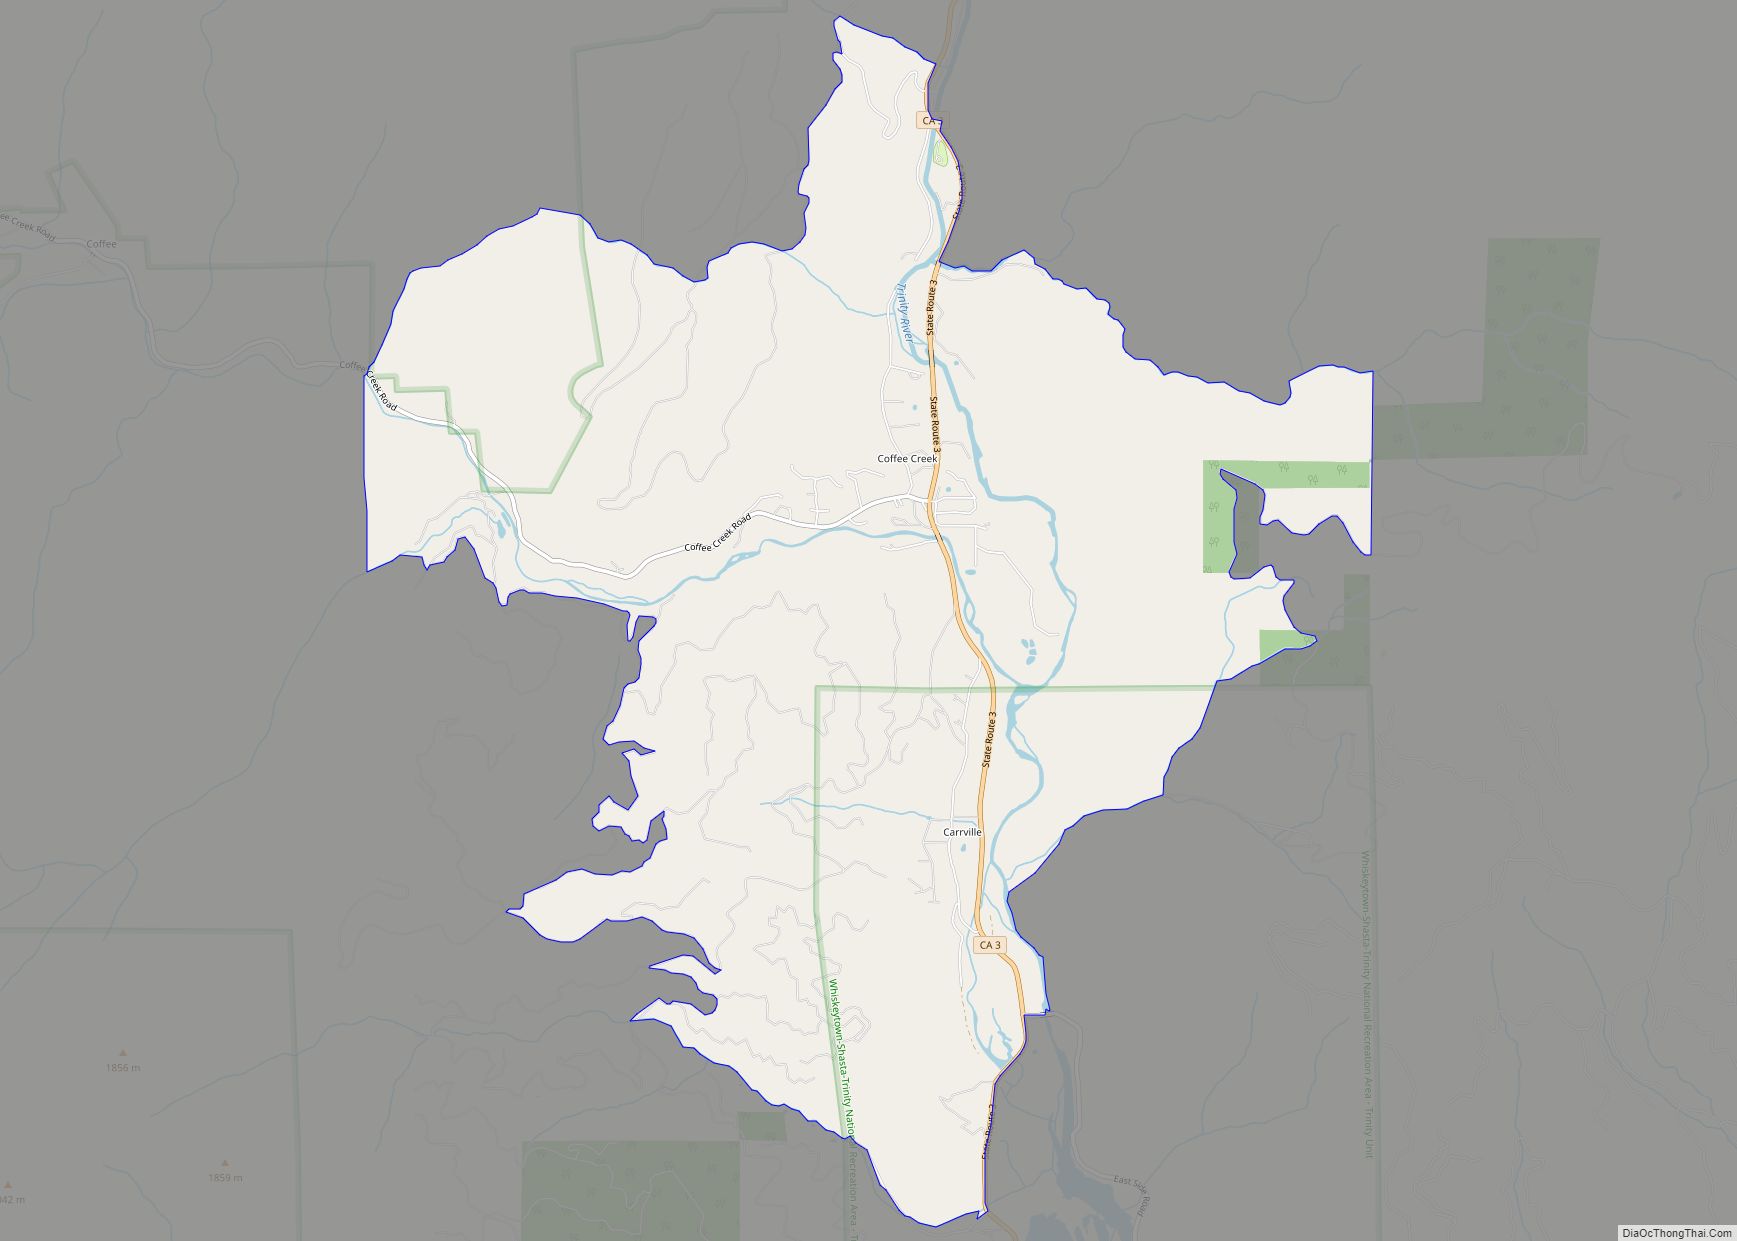
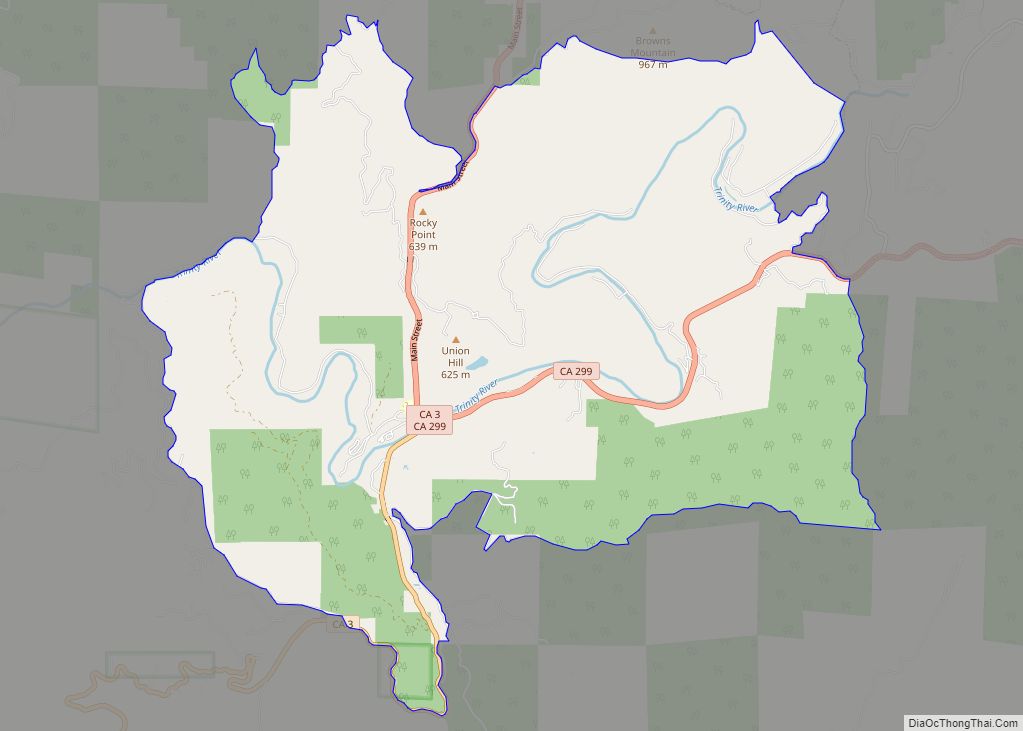
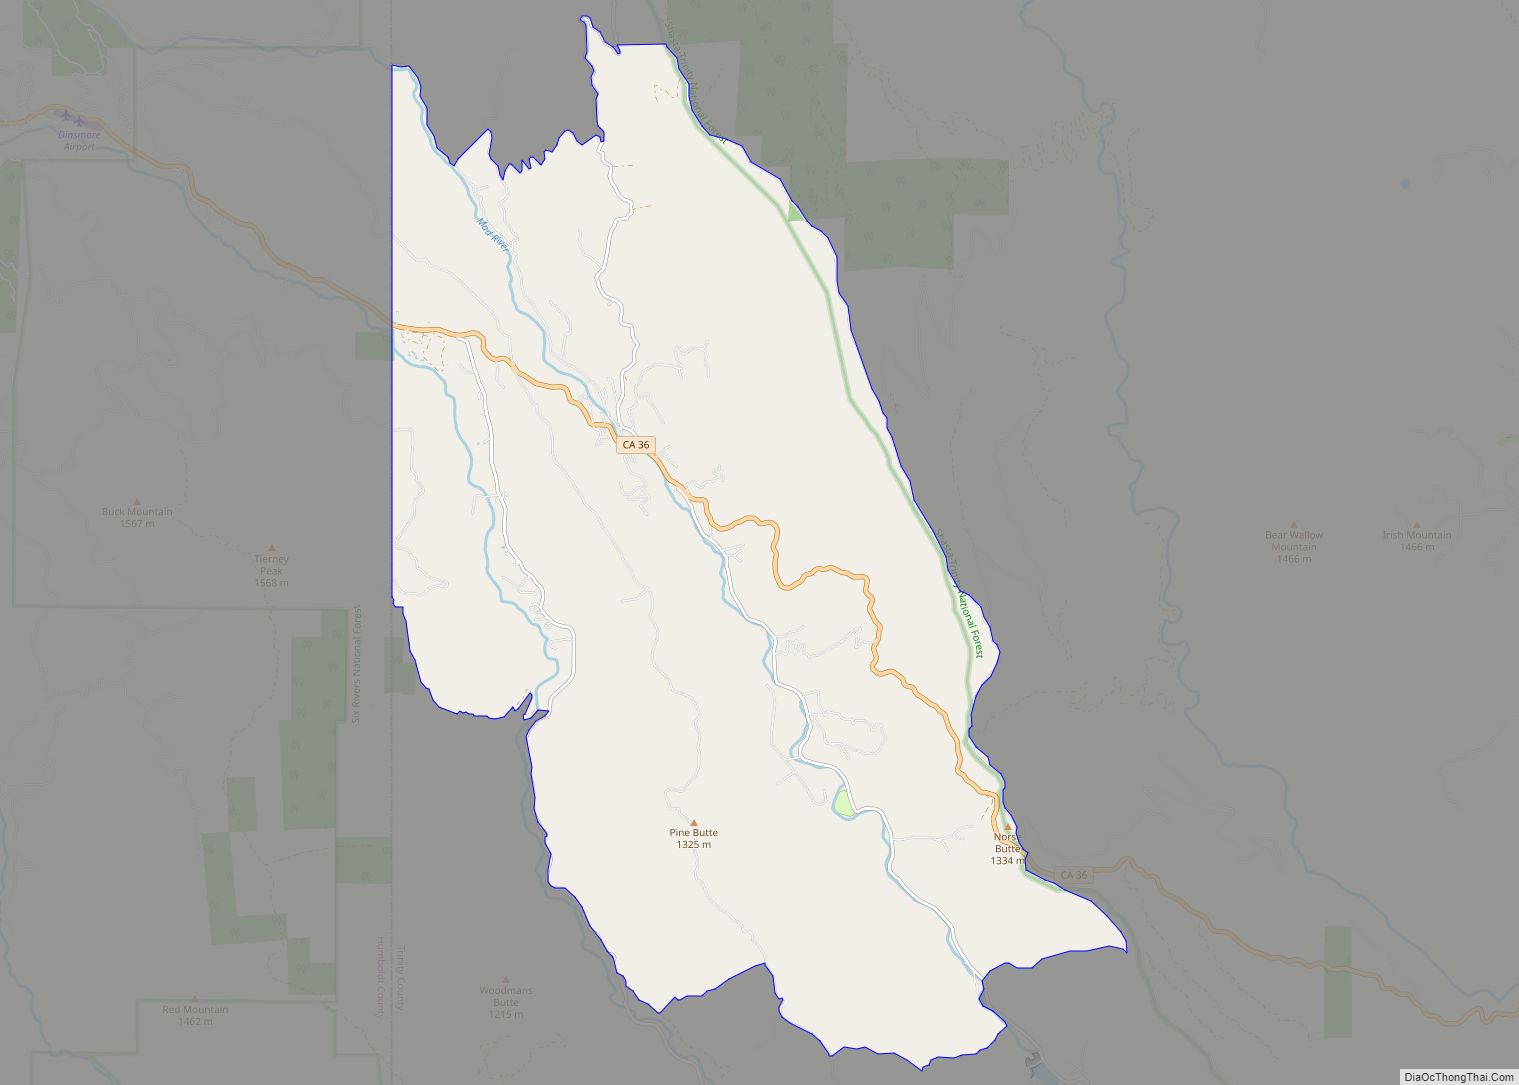
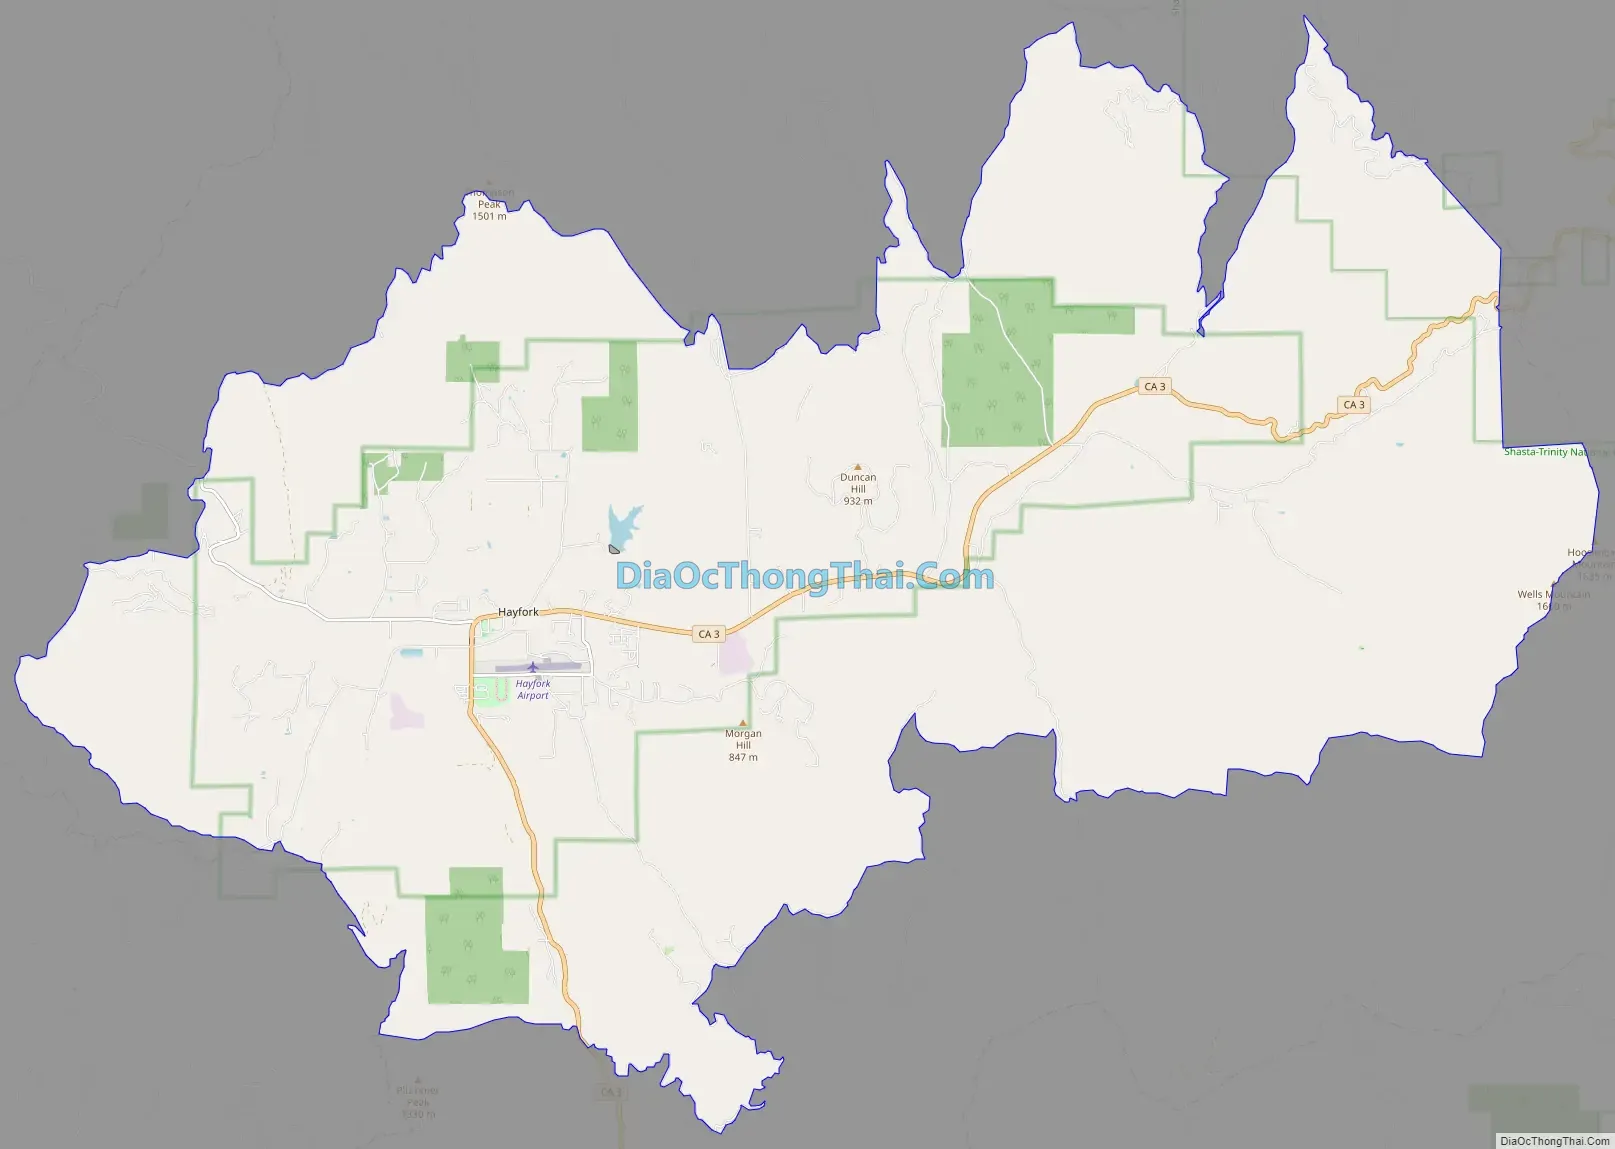
Hayfork Road Map
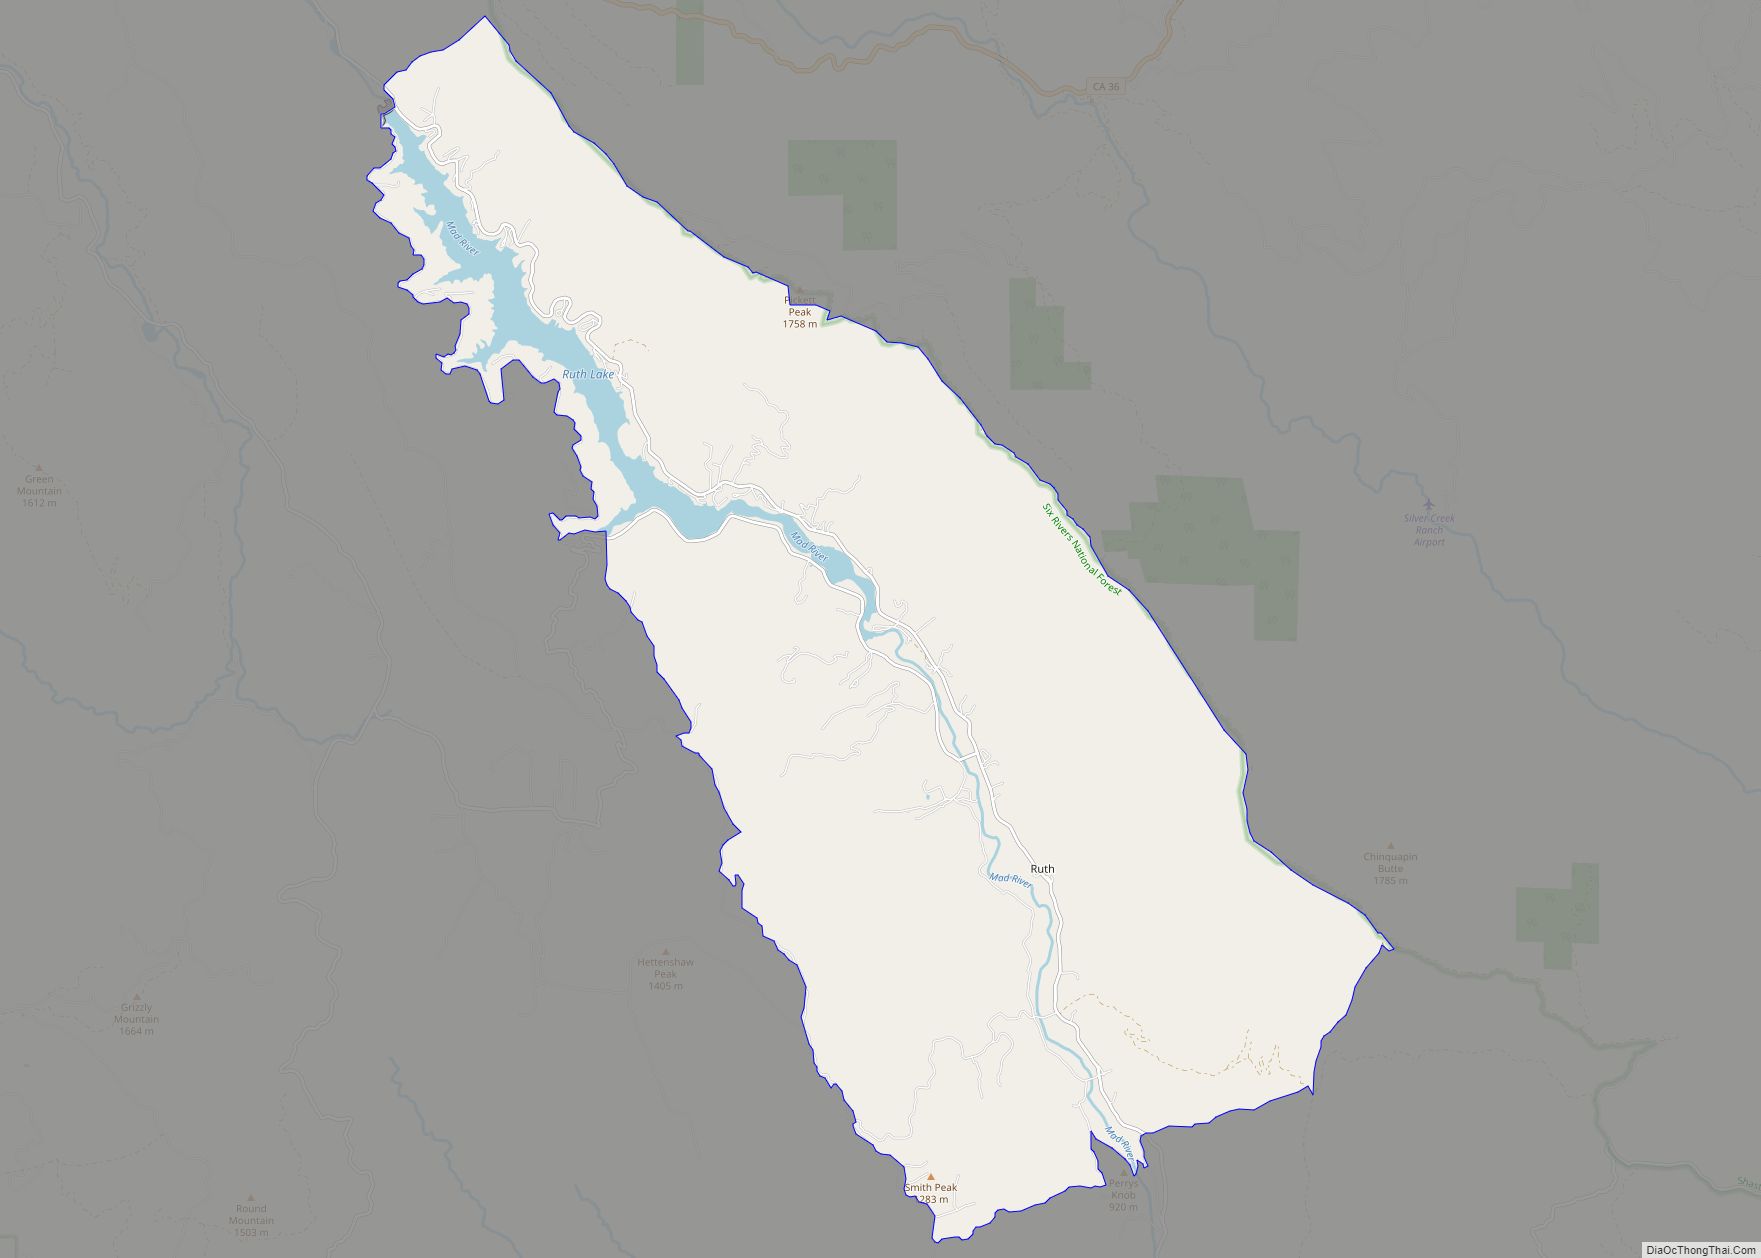
Hayfork city Satellite Map
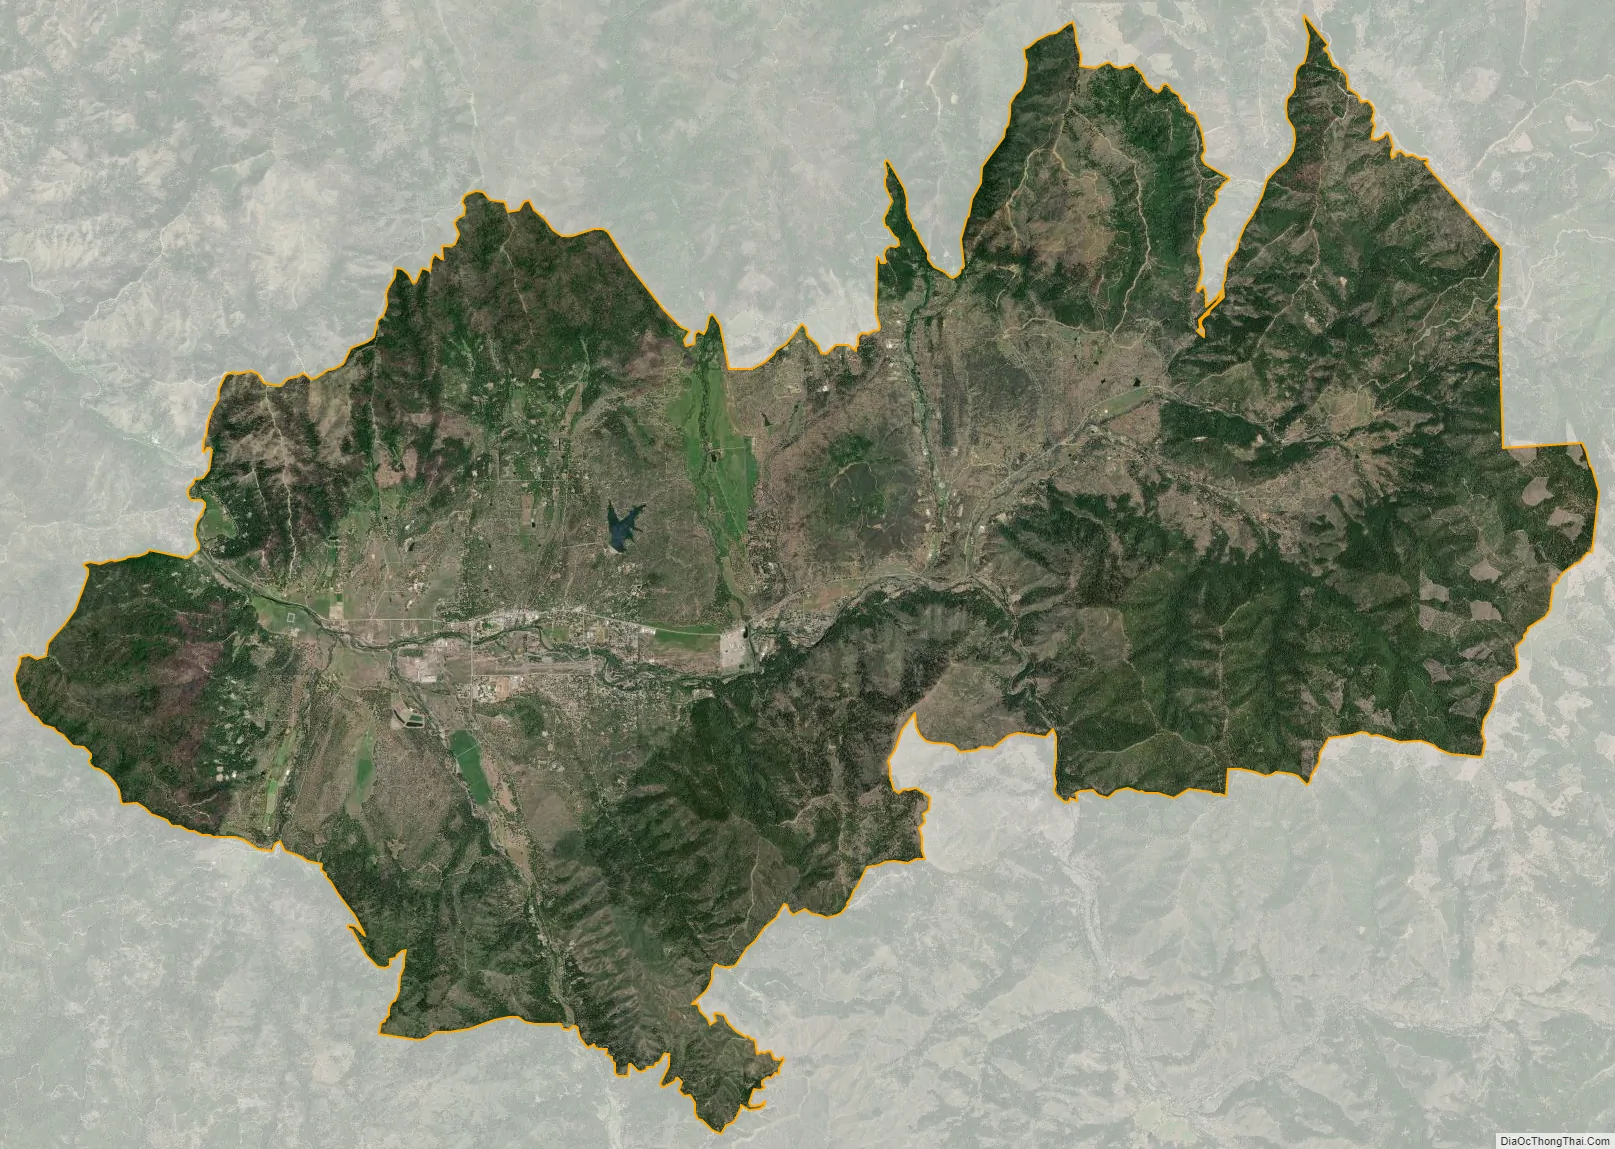
Geography
Hayfork is located at 40°34′17″N 123°8′48″W / 40.57139°N 123.14667°W / 40.57139; -123.14667 (40.571406, -123.146619) at an elevation of 2310 feet.
According to the United States Census Bureau, the CDP has a total area of 72.1 square miles (187 km), of which, 72.1 square miles (187 km) of it is land and 0.02 square miles (0.052 km) of it (0.03%) is water.
Climate
This region experiences warm (but not hot) and dry summers, with no average monthly temperatures above 71.6 °F. According to the Köppen Climate Classification system, Hayfork has a warm-summer Mediterranean climate, abbreviated “Csb” on climate maps. Hayfork experiences extreme diurnal temperature variation in summer, and also in winter the diurnals are wide enough to cause significant air frosts during night. Atypical for an area with such hot summertime temperatures and mild winters, frost usually occurs from mid September to early June, and frosts throughout the summer are not unheard of. There are an average of 69.8 days with a high over 90 degrees Fahrenheit, and 155 days that go below 32 degrees, including 1.7 days in June. On average, once every 10 years there will be a frost in July and 3 out of 10 years there will be one in August. Three times every ten years the temperature drops below zero. The same is true of having a daily high below 32 degrees: three in ten years. The town sees a mean of 2370.5 growing degree days with a base temperature of 50. Despite the USDA zone map showing the town in zone 8, NOAA records show that the town is actually in zone 7b, with the average coldest temperature experienced in a year being 6.8 degrees. The average hottest temperature in a year is 107.4 degrees. The record low high temperature is 30 degrees on 1/2 and 12/18 in 1924, and the record high low temperature is 64 degrees on reached five times: 7/19/2006, 7/22/2002, 7/26/1996, and 8/2 and 8/3 in 2003.
There are 80 days with precipitation of over 0.01 inches, 54 over 0.1 inches, 23 over 0.5 inches, and 9 over an inch. The record high monthly snowfall is 77.7 inches in January 1916, and traces of snowfall have been seen as late as 6/15 in 1950 and as early as 10/21 in 1961. Precipitation falls mostly as rain below 3300 feet and mostly as snow above that level, whereas Hayfork is at 2323 feet above sea level. The wettest “rain year” (July 1 to June 30) was 1982-83, with 72.69 inches of precipitation, and the driest was 1976-77 with 14.43 inches of precipitation.
See also
Map of California State and its subdivision:- Alameda
- Alpine
- Amador
- Butte
- Calaveras
- Colusa
- Contra Costa
- Del Norte
- El Dorado
- Fresno
- Glenn
- Humboldt
- Imperial
- Inyo
- Kern
- Kings
- Lake
- Lassen
- Los Angeles
- Madera
- Marin
- Mariposa
- Mendocino
- Merced
- Modoc
- Mono
- Monterey
- Napa
- Nevada
- Orange
- Placer
- Plumas
- Riverside
- Sacramento
- San Benito
- San Bernardino
- San Diego
- San Francisco
- San Joaquin
- San Luis Obispo
- San Mateo
- Santa Barbara
- Santa Clara
- Santa Cruz
- Shasta
- Sierra
- Siskiyou
- Solano
- Sonoma
- Stanislaus
- Sutter
- Tehama
- Trinity
- Tulare
- Tuolumne
- Ventura
- Yolo
- Yuba
- Alabama
- Alaska
- Arizona
- Arkansas
- California
- Colorado
- Connecticut
- Delaware
- District of Columbia
- Florida
- Georgia
- Hawaii
- Idaho
- Illinois
- Indiana
- Iowa
- Kansas
- Kentucky
- Louisiana
- Maine
- Maryland
- Massachusetts
- Michigan
- Minnesota
- Mississippi
- Missouri
- Montana
- Nebraska
- Nevada
- New Hampshire
- New Jersey
- New Mexico
- New York
- North Carolina
- North Dakota
- Ohio
- Oklahoma
- Oregon
- Pennsylvania
- Rhode Island
- South Carolina
- South Dakota
- Tennessee
- Texas
- Utah
- Vermont
- Virginia
- Washington
- West Virginia
- Wisconsin
- Wyoming