Snowville is a census-designated place (CDP) located in southeastern Pulaski County in the Commonwealth of Virginia. The population, as of the 2010 Census, was 149. It is part of the Blacksburg–Christiansburg Metropolitan Statistical Area.
| Name: | Snowville CDP |
|---|---|
| LSAD Code: | 57 |
| LSAD Description: | CDP (suffix) |
| State: | Virginia |
| County: | Pulaski County |
| Elevation: | 1,940 ft (591 m) |
| Total Area: | 149 |
| Population Density: | 66.2/sq mi (5.9/km²) |
| ZIP code: | 24347 |
| Area code: | 540 |
| FIPS code: | 5173376 |
Online Interactive Map
Click on ![]() to view map in "full screen" mode.
to view map in "full screen" mode.
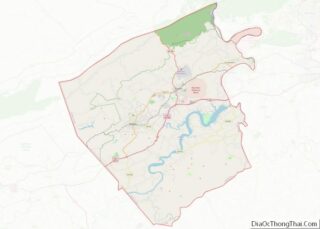
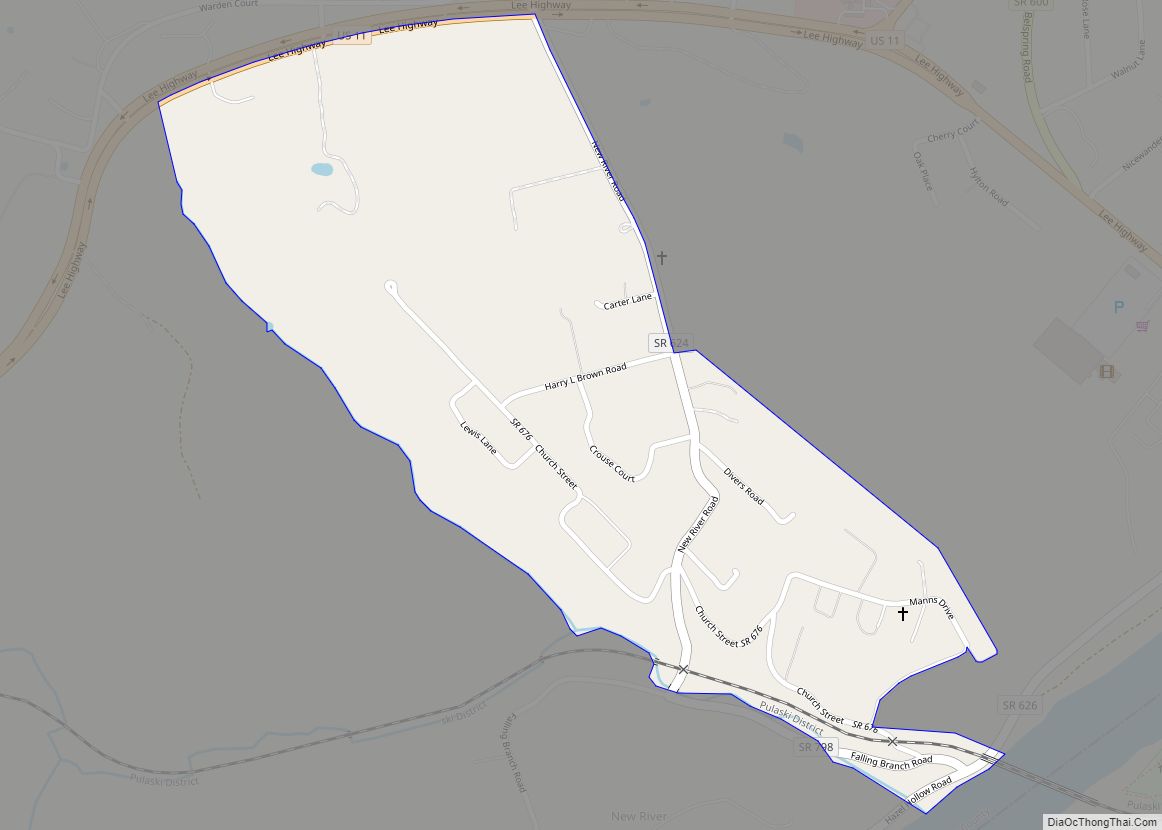
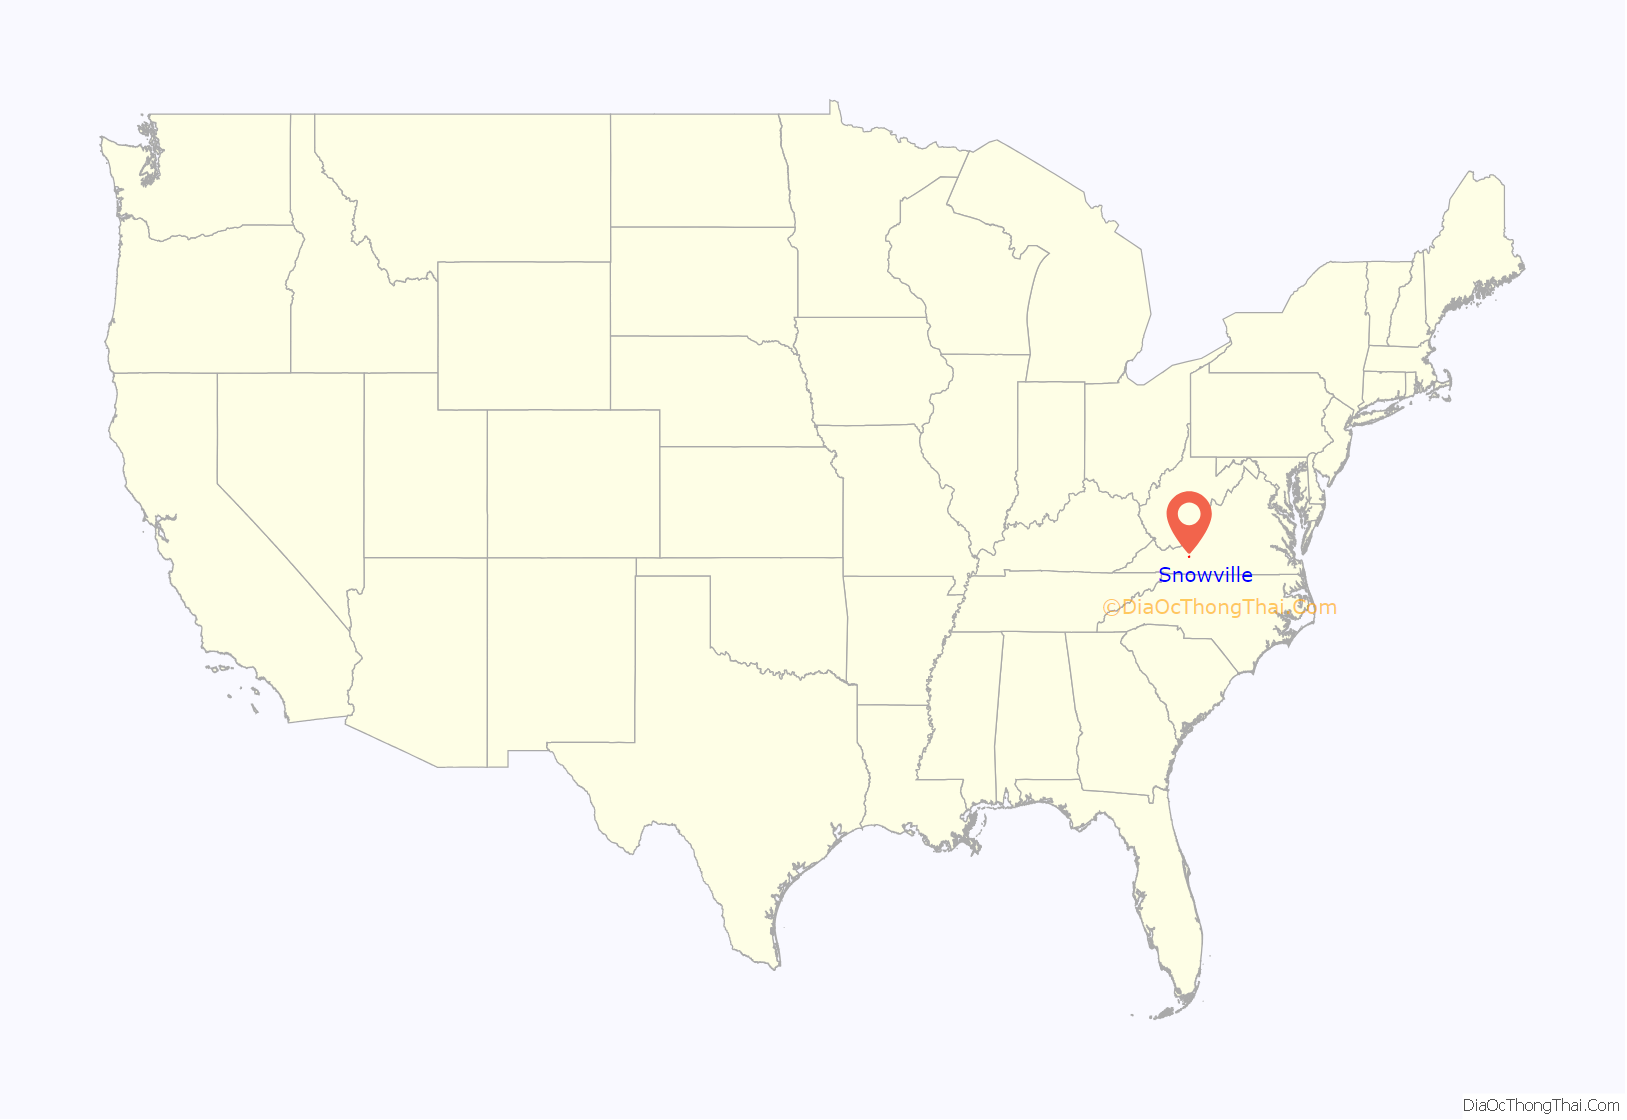
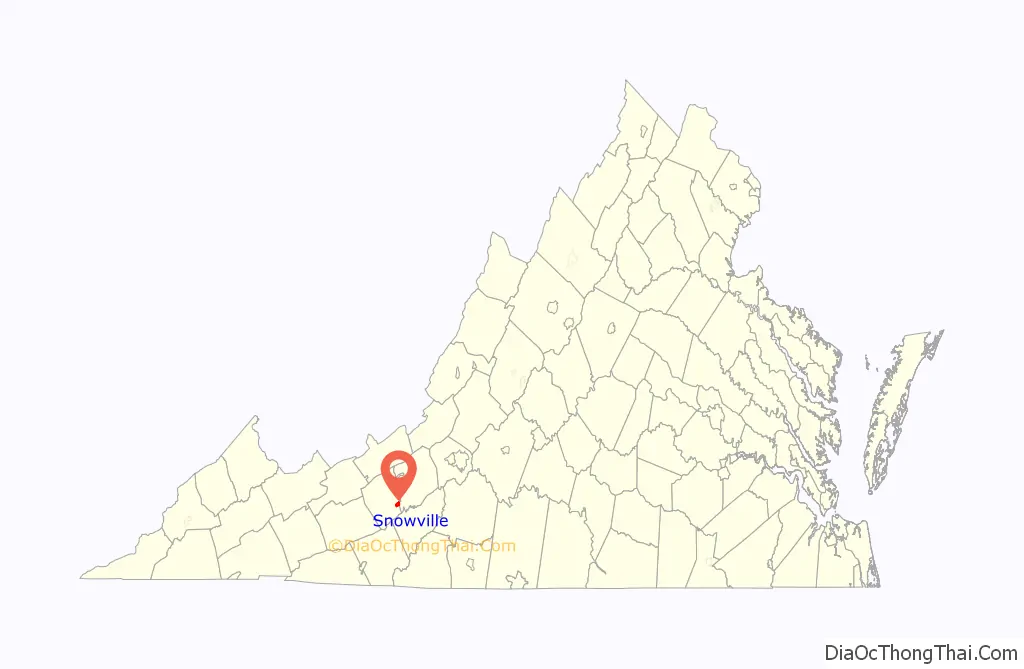
Snowville location map. Where is Snowville CDP?
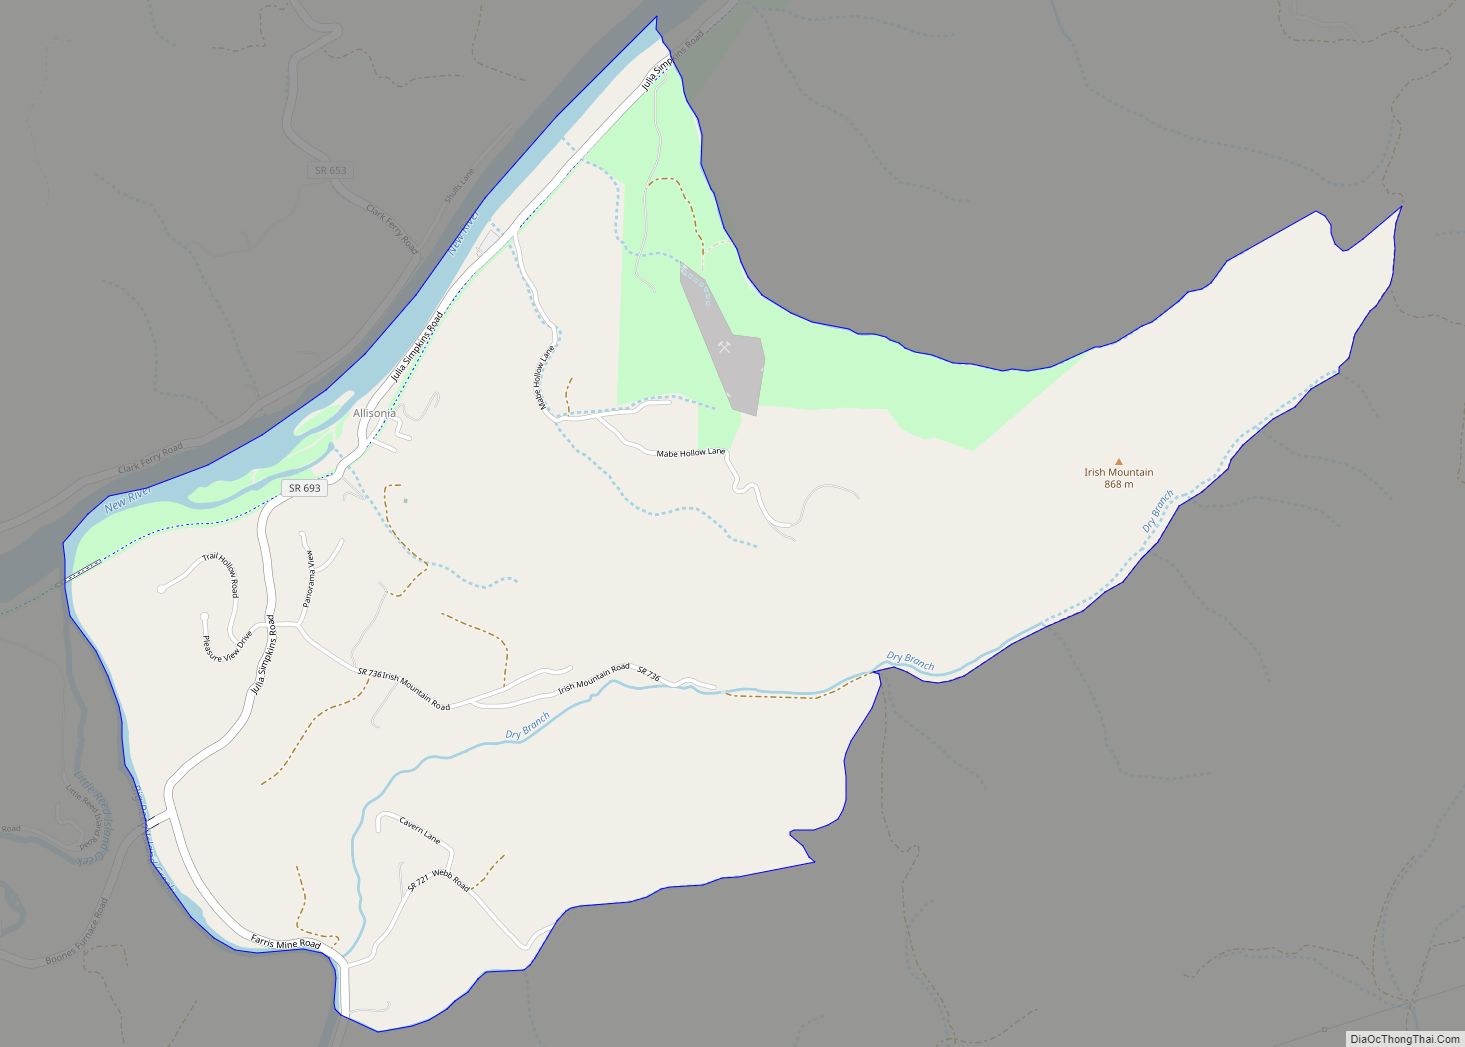
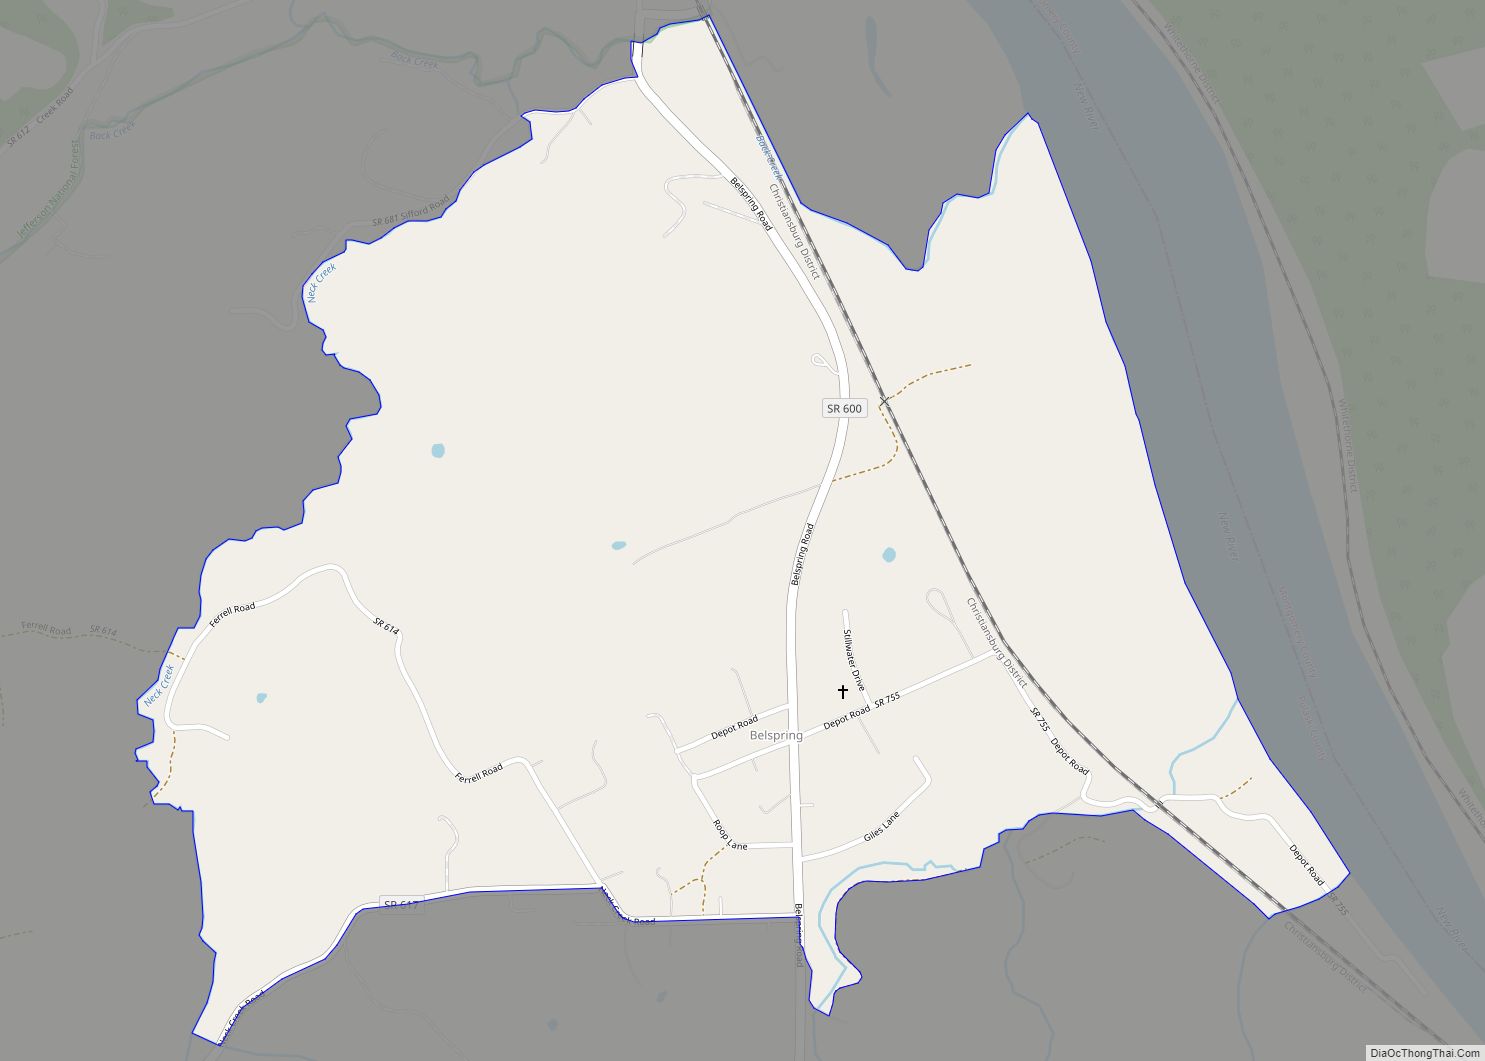
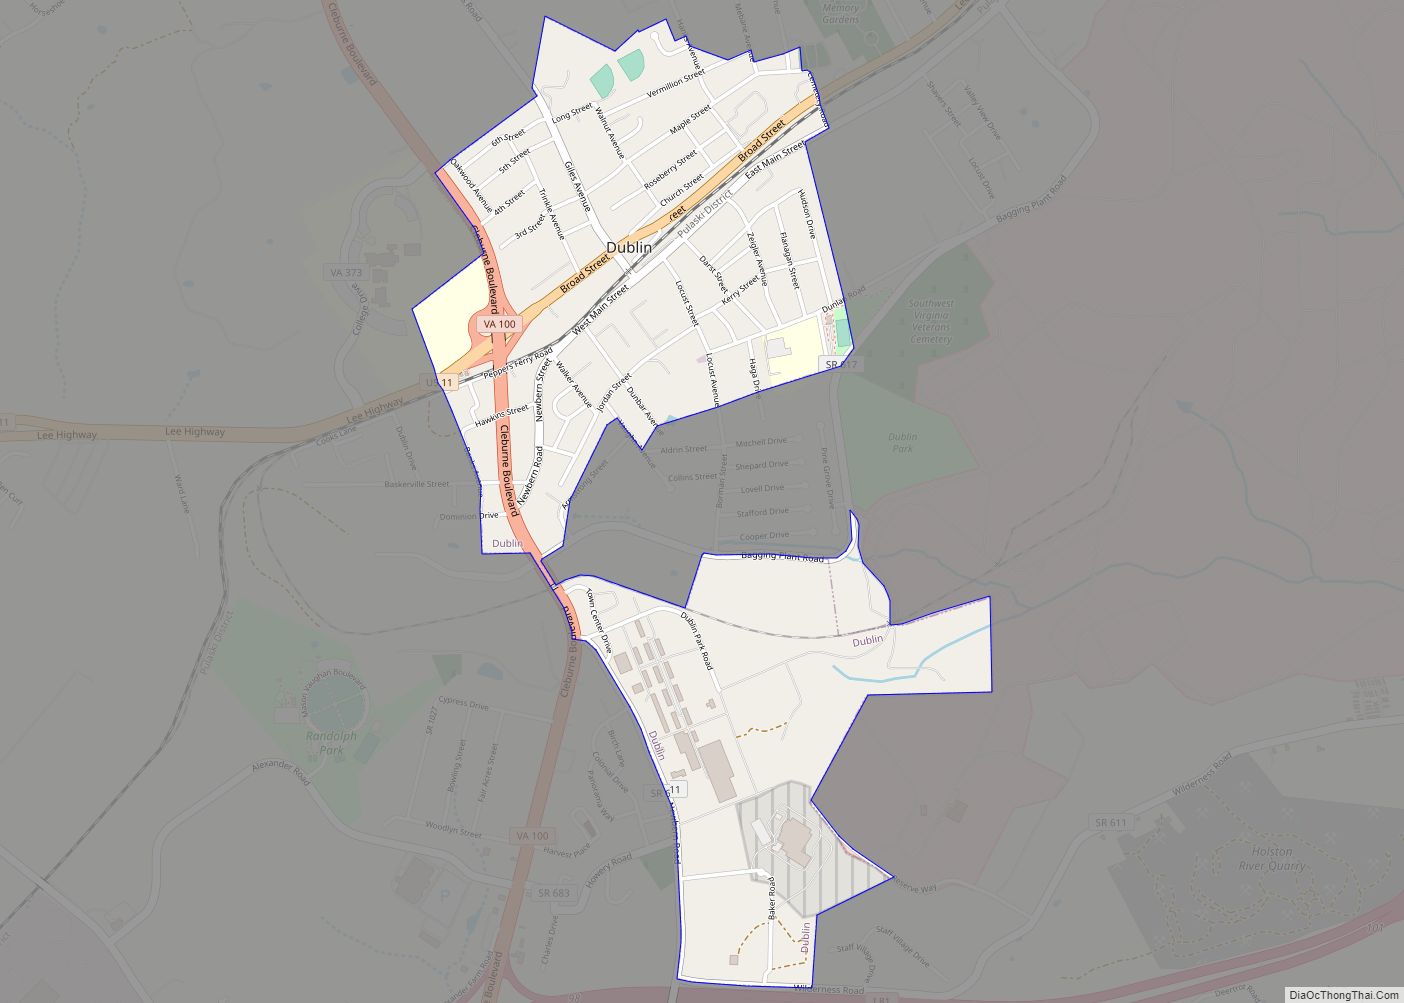
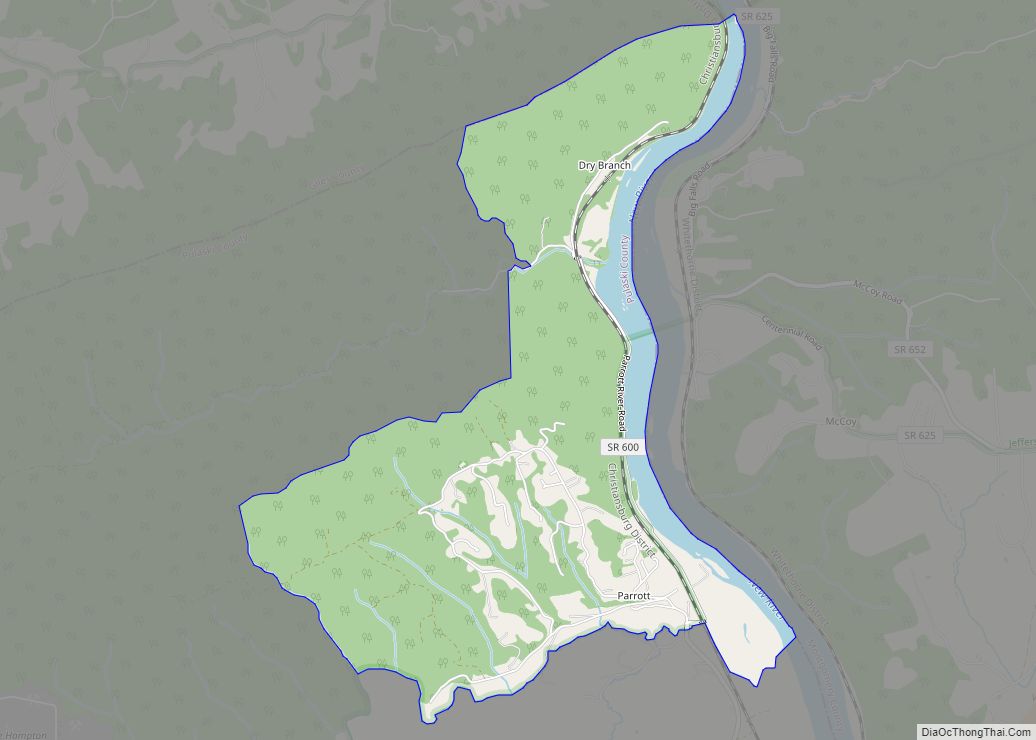
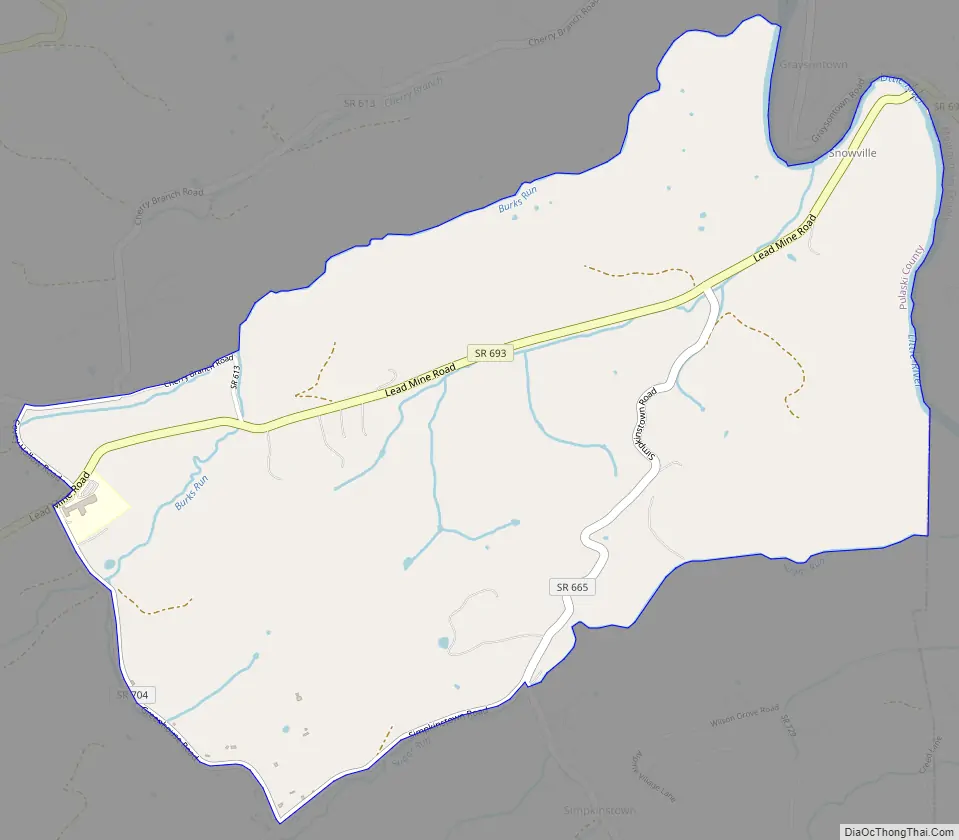
Snowville Road Map
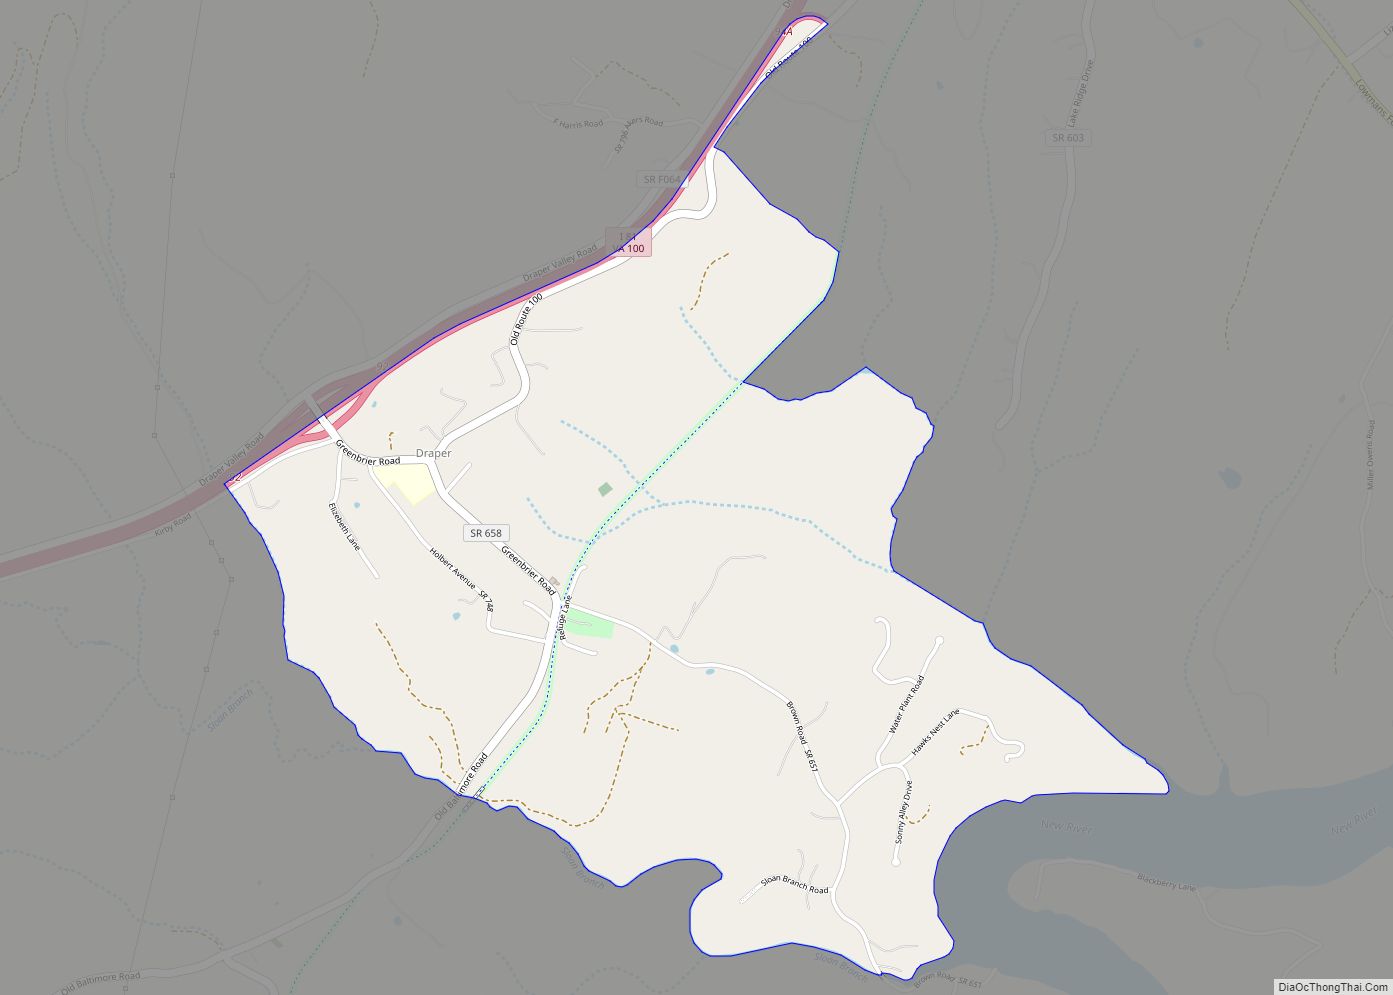
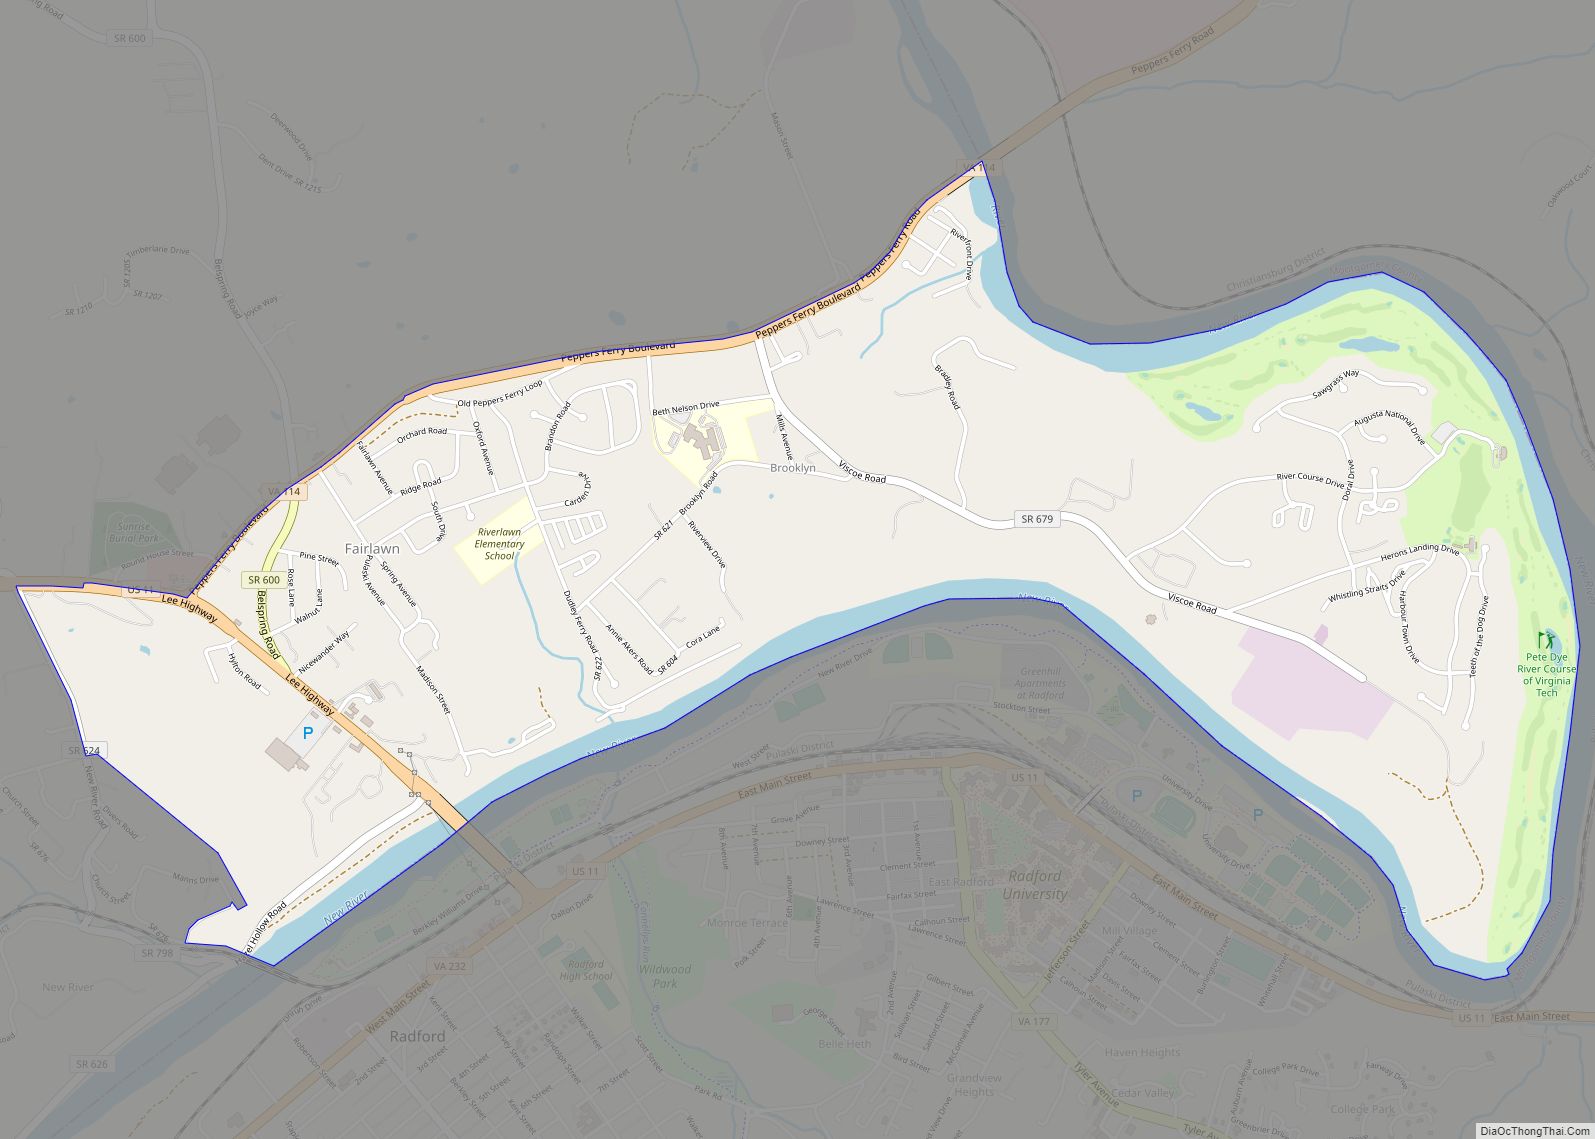
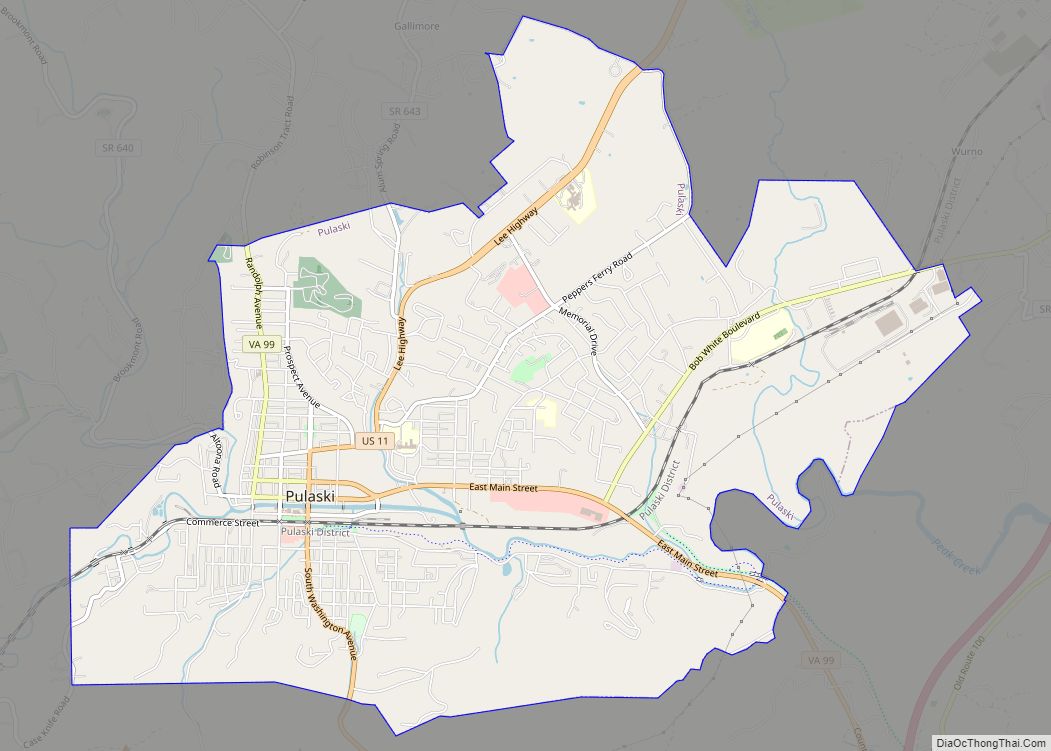
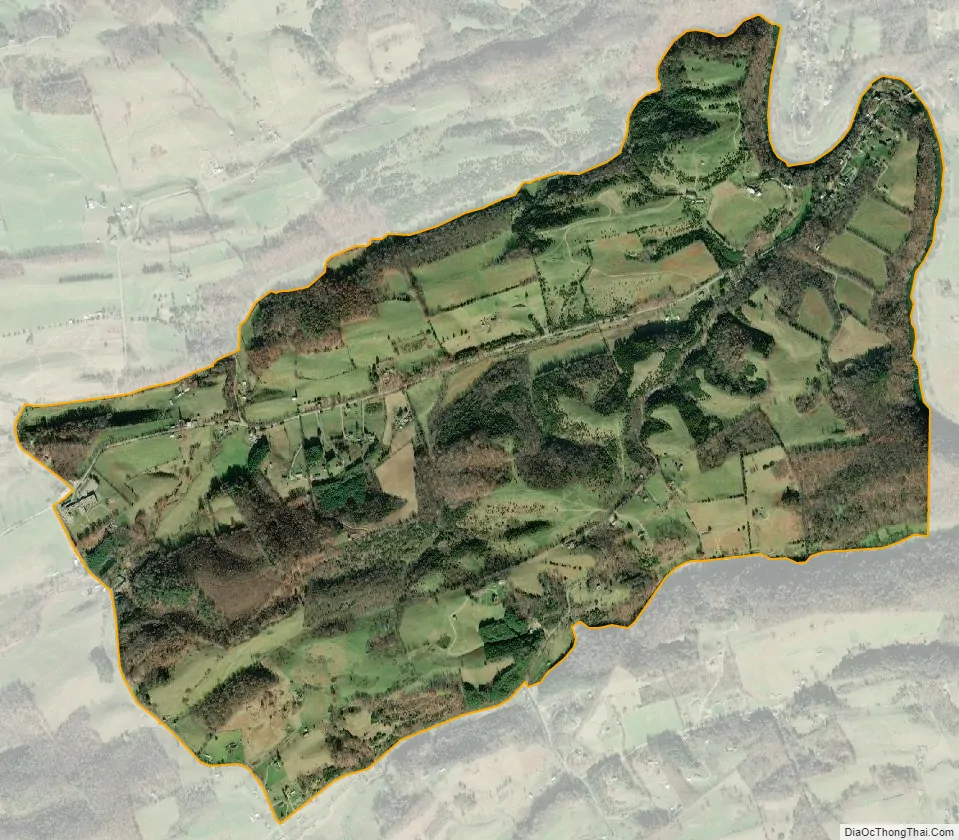
Snowville city Satellite Map
Geography
Snowville is located at 37° 1′ 57″N, 80° 33′ 40″W (37.032500°, -80.561111°). The community lies along the Little River, which forms the boundary between Pulaski County on the west side and Montgomery County on the east. Snowville lies within the Blue Ridge Mountains, part of the Appalachian Mountain Range, with High Knoll Mountain and Bench Mountain marking the southern extent of the community. It is bounded to the north by Claytor Lake.
Snowville and Pulaski County are located in a temperate climatic zone, with average winter temperatures in the 30s and 40s (degrees Fahrenheit) and summer temperatures in the 70s and 80s. Average winter snowfall amounts range from 12 to 24 inches (300 to 610 mm). During spring, flash flooding can occur with runoff from nearby mountains, and during fall tropical storms can bring heavy amounts of rainfall and damaging winds, such as during Hurricane Hugo in 1989. Research has been undertaken at Virginia Tech and at the National Weather Service office in Blacksburg to examine the potential for flash flooding along creeks, streams, and rivers in Pulaski County using geographic information systems (GIS) and field methods. Extreme heat and drought are rare, but have occurred, as have very cold temperatures below 0° Fahrenheit.
Weather and Climate History
The worst river flooding in Snowville’s recorded history occurred on August 14, 1940, with the passage of a slow-moving tropical depression. The 1940 hurricane season produced eight storms, four of which were hurricanes. Around August 5 of that year, a tropical storm was detected along the northern Leeward Islands in the West Indies. The storm brought wind gusts of 44 mph to San Juan, Puerto Rico as it moved northwestward. By August 6 it began a turn to the north while producing rough seas in the southeastern Bahamas. Four days later on August 10 the S.S. Maine off the southeast coast measured hurricane-force winds and the storm began movement again toward the northwest. The storm made landfall as a category 1 hurricane on August 11 at approximately 4 PM near Beaufort, South Carolina (along the SC/GA border). Winds reached 73 mph in nearby Savannah, Georgia.
As the Georgia-South Carolina hurricane of 1940 moved inland, record rainfall amounts were observed from South Carolina north through the Smoky Mountains and into southwest and central Virginia. The storm meandered along the Cumberland Plateau region as rain began falling in Virginia on August 13. The mountainous terrain coupled with extremely slow movement from the now tropical depression produced copious amounts of rain. Copper Hill in Floyd County, Virginia received the highest rainfall in the state: 17.03″.
The United States Geological Survey (USGS) stream gauge located at the Snowville bridge along the Little River (see photo at right) measured an all-time record height of 16 feet 5 inches which is more than 15 higher than what is normally observed throughout the year. Downstream in Radford, Virginia residents in low-lying areas were forced to evacuate their homes and both the former Burlington Mills and the Lynchburg Foundry manufacturing plants were shut down because of high water. The road leading from Radford into Pulaski County towards Claytor Lake Dam was inundated and impassable. Thankfully, no deaths were reported across southwest Virginia, but several million dollars worth of damage occurred (1940 USD).
On October 18, 2011, a sign recognizing the historic flooding was installed along the Little River at the Graysontown-Snowville bridge. The sign was donated by local resident Anthony Phillips, a hydrometeorologist from Snowville, Virginia and installation was sponsored by the National Weather Service and the United States Geological Survey through the High Water Mark (HWM) Project. The project helps raise awareness of flood risk by installing high-water mark signs in prominent locations within communities that have experienced severe flooding.
More recently in 2004, the remnants of Hurricane Jeanne produced flooding when the Little River reached a height of 11 feet 4 inches, the ninth-highest crest of all time.
See also
Map of Virginia State and its subdivision:- Accomack
- Albemarle
- Alexandria
- Alleghany
- Amelia
- Amherst
- Appomattox
- Arlington
- Augusta
- Bath
- Bedford
- Bedford City
- Bland
- Botetourt
- Bristol
- Brunswick
- Buchanan
- Buckingham
- Buena Vista
- Campbell
- Caroline
- Carroll
- Charles City
- Charlotte
- Charlottesville
- Chesapeake
- Chesterfield
- Clarke
- Clifton Forge City
- Colonial Heights
- Covington
- Craig
- Culpeper
- Cumberland
- Danville
- Dickenson
- Dinwiddie
- Emporia
- Essex
- Fairfax
- Fairfax City
- Falls Church
- Fauquier
- Floyd
- Fluvanna
- Franklin
- Frederick
- Fredericksburg
- Galax
- Giles
- Gloucester
- Goochland
- Grayson
- Greene
- Greensville
- Halifax
- Hampton
- Hanover
- Harrisonburg
- Henrico
- Henry
- Highland
- Hopewell
- Isle of Wight
- James City
- King and Queen
- King George
- King William
- Lancaster
- Lee
- Lexington
- Loudoun
- Louisa
- Lunenburg
- Lynchburg
- Madison
- Manassas
- Manassas Park
- Martinsville
- Mathews
- Mecklenburg
- Middlesex
- Montgomery
- Nelson
- New Kent
- Newport News
- Norfolk
- Northampton
- Northumberland
- Norton
- Nottoway
- Orange
- Page
- Patrick
- Petersburg
- Pittsylvania
- Poquoson
- Portsmouth
- Powhatan
- Prince Edward
- Prince George
- Prince William
- Pulaski
- Radford
- Rappahannock
- Richmond
- Roanoke
- Roanoke City
- Rockbridge
- Rockingham
- Russell
- Salem
- Scott
- Shenandoah
- Smyth
- Southampton
- Spotsylvania
- Stafford
- Staunton
- Suffolk
- Surry
- Sussex
- Tazewell
- Virginia Beach
- Warren
- Washington
- Waynesboro
- Westmoreland
- Williamsburg
- Winchester
- Wise
- Wythe
- York
- Alabama
- Alaska
- Arizona
- Arkansas
- California
- Colorado
- Connecticut
- Delaware
- District of Columbia
- Florida
- Georgia
- Hawaii
- Idaho
- Illinois
- Indiana
- Iowa
- Kansas
- Kentucky
- Louisiana
- Maine
- Maryland
- Massachusetts
- Michigan
- Minnesota
- Mississippi
- Missouri
- Montana
- Nebraska
- Nevada
- New Hampshire
- New Jersey
- New Mexico
- New York
- North Carolina
- North Dakota
- Ohio
- Oklahoma
- Oregon
- Pennsylvania
- Rhode Island
- South Carolina
- South Dakota
- Tennessee
- Texas
- Utah
- Vermont
- Virginia
- Washington
- West Virginia
- Wisconsin
- Wyoming